NEM Stock Analysis: A Mixed Bag of Signals!
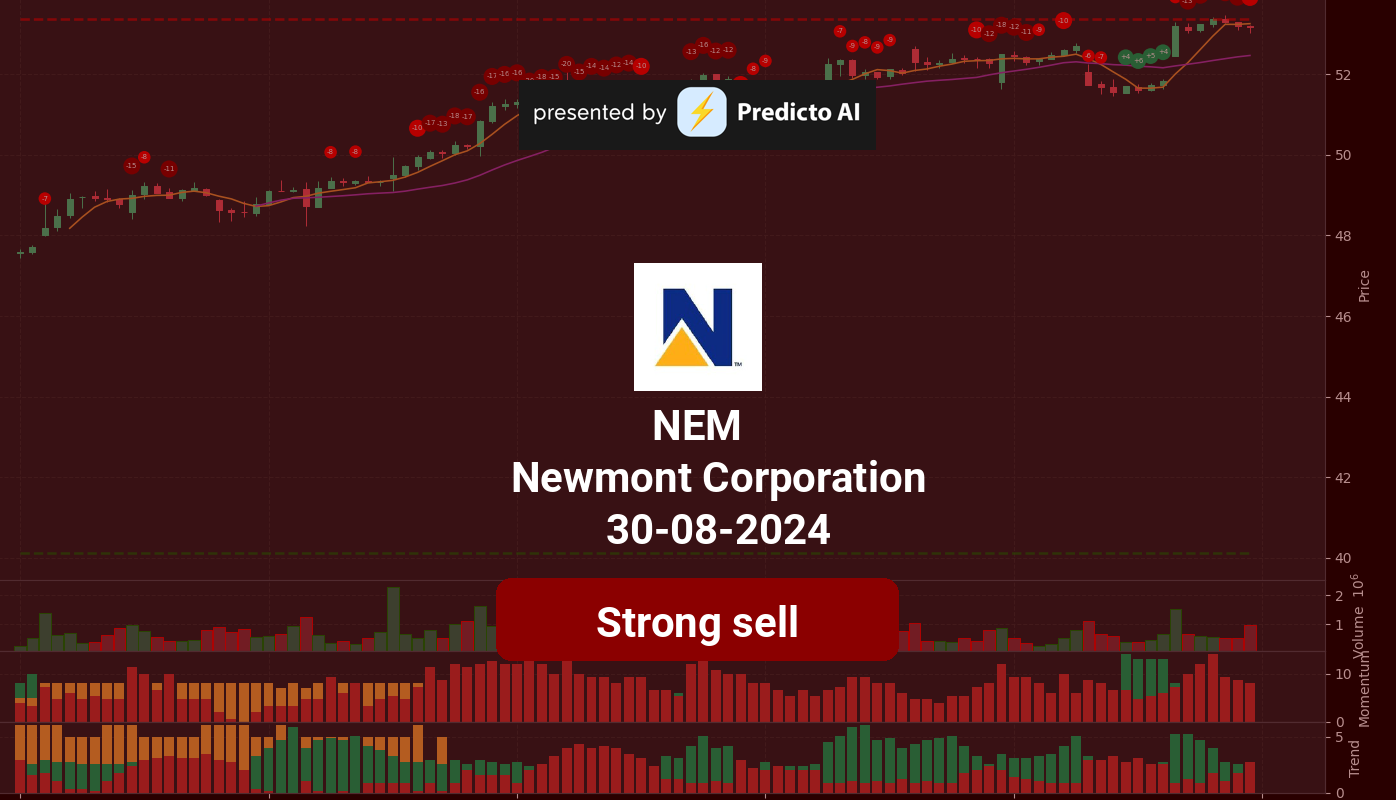
🔴 Recommendation: NEM is currently rated as a Strong Sell, reflecting significant caution among investors due to a combination of bullish and bearish indicators.
📈 Key Highlights:
Financial Health: NEM reported a net income of $838 million, showcasing profitability and a year-over-year increase that bodes well for future performance.
Valuation: With a forward P/E ratio of 14.18, the stock may be undervalued, presenting a potential entry point for investors.
Growth: Revenue growth of 9.42% year-over-year indicates moderate growth, while impressive earnings growth of 284.30% suggests strong business performance.
⚠️ Caution Flags:
Overbought Conditions: The StochRSI indicates that NEM is in an overbought state, signaling a potential price correction.
Declining Volume: A decrease in On-Balance Volume raises concerns about the sustainability of current price levels.
High Debt Levels: With an average net debt of $4.74 billion, financial flexibility is a concern that requires monitoring.
As we delve deeper into the analysis, we will explore the price trends, various indicators, financial health, valuation metrics, and more to provide a comprehensive overview of NEM’s current standing and future outlook. Stay tuned for the details! 👇
NEM Price Analysis
| Positive Momentum Signals | Negative Momentum Signals | Hold Momentum Signals |
|---|---|---|
|
|
|
| Positive Trend Signals | Negative Trend Signals | Hold Trend Signals |
|---|---|---|
|
|
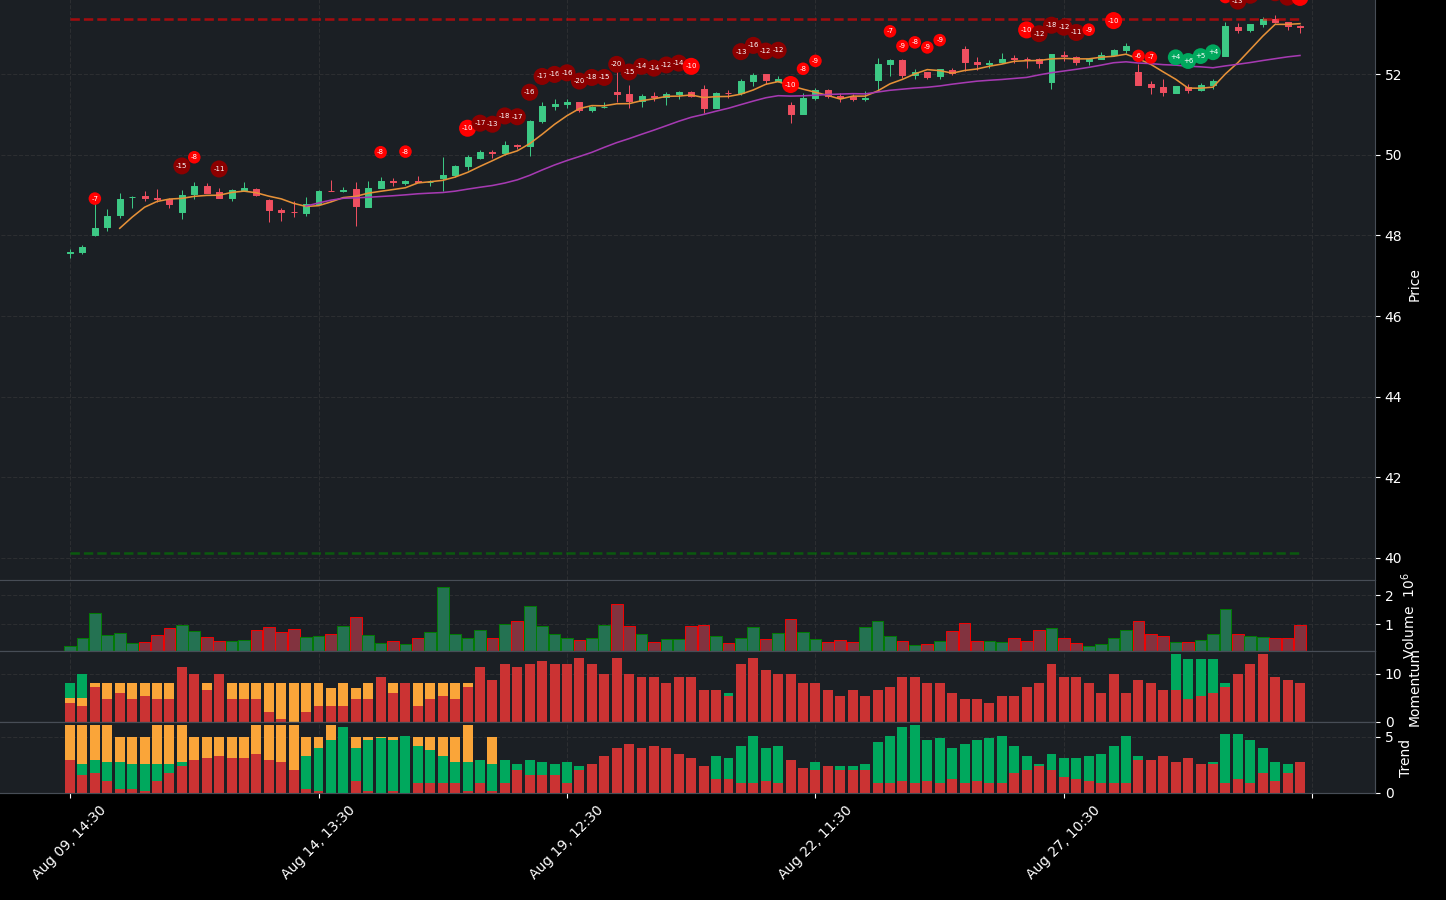
NEM stock presents a complex financial picture, characterized by both bullish and bearish indicators. Currently, the stock is rated as a strong sell, reflecting significant caution among investors.
On the positive side, there are some encouraging momentum indicators. The WaveTrend shows a bullish divergence, suggesting a potential reversal in the stock’s price trend. Additionally, the stock is trading above the 50-day and 200-day EMA, indicating a bullish trend that is strengthening. The price is also above the Supertrend line, further supporting the notion of an upward trend. However, it is important to note that the stock is currently closer to resistance, which could limit further upward movement.
Conversely, several negative momentum indicators raise concerns. The StochRSI is in an overbought condition, suggesting that the stock may be due for a correction. The On-Balance Volume (OBV) is decreasing, indicating that high volume is not supporting the current price levels, which could signal weakening buying interest. Furthermore, the MACD has shown a negative histogram crossover, which is often a bearish signal.
In summary, while NEM stock exhibits some positive trends, the overall sentiment is cautious due to overbought conditions and declining volume indicators. Investors should be wary of the potential for a price correction, especially given the strong sell recommendation. It may be prudent to monitor the stock closely for any signs of a reversal or further deterioration in momentum before making any investment decisions.
NEM Fundamental Analysis
NEM’s recent financial performance presents a compelling case for investment, showcasing strong profitability and growth potential despite some notable concerns.
The company reported a net income of $838 million for the most recent period, indicating solid profitability. Furthermore, the year-over-year increase in net income is a positive sign for future performance. NEM’s operating margin stands at an impressive 100.00%, reflecting highly efficient operations and excellent cost control. Additionally, a net profit margin of 19.04% demonstrates strong profitability after accounting for all expenses.
However, there are some red flags to consider. The net interest income was negative at $65 million, suggesting that the company is paying more in interest than it earns on its assets. Moreover, the average net debt is high at $4.74 billion, which necessitates careful monitoring regarding financial flexibility.
In terms of valuation, NEM appears to be potentially undervalued with a forward P/E ratio of 14.18, indicating a good entry point for investors. The price-to-sales ratio of 4.10 is reasonable given the revenue growth, suggesting fair valuation. Notably, the company has demonstrated remarkable earnings growth of 284.30%, indicating strong business performance and potential for future appreciation.
NEM’s growth metrics are also encouraging, with a revenue growth of 9.42% year-over-year, which is positive for stock price appreciation. The operating margin of 30.53% further underscores strong operational efficiency. However, it is concerning that profit margins are negative at -13.29%, which could indicate challenges in controlling costs.
From a shareholder perspective, NEM has engaged in stock repurchases totaling $261.5 million, signaling management’s confidence in the company’s future and potentially boosting earnings per share. The average ordinary shares outstanding at 1,009 million indicates a stable share structure, which is favorable for investors.
Examining the income statement, NEM reported total revenue of $4.4 billion, showcasing strong sales performance. The year-over-year revenue growth of 64.10% is particularly impressive, indicating increasing demand for its products.
On the balance sheet, the current ratio of 5.11 indicates a strong liquidity position, suggesting that the company can comfortably cover its short-term liabilities. The debt-to-equity ratio of 0.36 reflects a moderate level of leverage, which is manageable given the company’s profitability. However, the cash to total assets ratio of 0.06 indicates limited financial flexibility, which could be a concern in economic downturns.
In terms of cash flow, NEM’s average capital expenditures of $1.94 billion suggest that the company is investing in growth and expansion. The positive net cash from financing of $1.22 billion indicates that the company is raising capital, which could be utilized for growth or debt reduction. Nonetheless, the negative free cash flow of -$2.77 billion raises concerns about the company’s ability to fund operations without additional financing.
Overall, NEM demonstrates strong profitability and growth potential, with positive indicators outweighing the negatives. The recommendation is to buy, as the company’s solid financial health and growth prospects present an attractive opportunity for investors.
Financial Health
🟢 Net Income for the most recent period was $838 million, indicating profitability.
🟢 Year-over-year net income increased, which is a positive sign for future performance.
🟢 Operating Margin of 100.00% suggests highly efficient operations and excellent cost control.
🟢 Net Profit Margin of 19.04% reflects strong profitability after all expenses.
🔴 Net Interest Income was negative at $65 million, indicating the company is paying more in interest than it earns on its assets.
🔴 Average Net Debt is high at $4.74 billion, which requires careful monitoring regarding financial flexibility.
Valuation
🟢 Forward P/E ratio of 14.18 suggests potential undervaluation, indicating a good entry point for investors.
🟢 Price-to-Sales Ratio of 4.10 is reasonable given the revenue growth, suggesting fair valuation.
🟢 Earnings Growth of 284.30% indicates strong business performance and potential for future appreciation.
Growth and Profitability
🟢 Revenue Growth of 9.42% year-over-year suggests moderate growth, which is positive for stock price appreciation.
🟢 Operating Margin of 30.53% indicates strong operational efficiency.
🔴 Profit Margins are negative at -13.29%, which could indicate challenges in controlling costs.
Shareholder Information
🟢 Stock Repurchases of $261.5 million can signal management’s confidence in the company’s future and may boost earnings per share.
🟢 Average Ordinary Shares Outstanding at 1,009 million indicates a stable share structure, which is positive for investors.
Income Statement
🟢 Total Revenue for the most recent period was $4.4 billion, showing strong sales performance.
🟢 Year-over-year revenue growth of 64.10% is impressive and indicates increasing demand for products.
Balance Sheet
🟢 Current Ratio of 5.11 indicates a strong liquidity position, suggesting the company can comfortably cover its short-term liabilities.
🟢 Debt-to-Equity Ratio of 0.36 suggests a moderate level of leverage, which is manageable given the company’s profitability.
🔴 Cash to Total Assets Ratio of 0.06 indicates limited financial flexibility, which could be a concern in economic downturns.
Cashflow
🟢 Average Capital Expenditures of $1.94 billion suggest the company is investing in growth and expansion.
🟢 Positive Net Cash from Financing of $1.22 billion indicates that the company is raising capital, which could be used for growth or debt reduction.
🔴 Free Cash Flow is negative at -$2.77 billion, raising concerns about the company’s ability to fund operations without additional financing.
Overall, the company shows strong profitability and growth potential, despite some concerns regarding debt levels and cash flow. The positive indicators outweigh the negatives, leading to a recommendation to buy.
NEM News Analysis
Positive developments for Newmont Corporation (NEM) indicate a favorable outlook for investors.
Summary of NEM news highlights a series of positive analyst upgrades and recognitions that bolster investor confidence. The upgrade from Argus Research to a “Buy” rating with a price target of $58 is particularly significant, suggesting strong potential for price appreciation. Additionally, the recognition of Newmont’s Lori Douglas as a “Woman on the Rise” adds to the company’s positive public image. Overall, these developments suggest a bullish sentiment for NEM in the coming month.
🟢 Argus Research has upgraded Newmont Corporation (NEM) to a “Buy” from “Hold” with a price target of $58, indicating strong confidence in the company’s future performance.
🟢 The upgrade reflects positive sentiment and potential for price appreciation, which could attract more investors.
🟢 Newmont’s Lori Douglas has been honored as a 2024 Paradigm for Parity Woman on the Rise, enhancing the company’s reputation and commitment to diversity.
🔴 The broader market conditions and commodity price fluctuations could still pose risks, but the current news is overwhelmingly positive.
🟢 Overall, the analyst report and recognition of leadership suggest that NEM is well-positioned for growth in the near term.
NEM Holders Analysis
The financial health of NEM presents a mixed outlook, leading to a neutral recommendation for the next month. While there are positive aspects, certain factors raise concerns.
🟢 NEM has a **high institutional ownership** at **73.06%**, indicating strong interest from large investors, which typically suggests confidence in the company’s future performance. This level of institutional backing can provide stability and support for the stock price.
🟡 The **low insider ownership** at **0.10%** raises questions about management’s confidence in the company’s prospects. This could indicate a lack of alignment between management and shareholder interests, which is a potential red flag.
🟡 The **number of institutional holders** is substantial at **1674**, suggesting a diversified ownership base. This can mitigate volatility, but it also means that large sell-offs by institutions could impact the stock price significantly.
🔴 Recent **insider transactions** show a higher volume of sales compared to purchases, which may signal a lack of confidence among insiders. The **insider purchases** over the last six months are relatively low, with only **121,242 shares bought** against **34,000 shares sold**.
🔴 The **mutual fund holdings** have seen slight fluctuations, with the latest report showing a value of **1,035,522,752**. This could indicate some uncertainty among mutual fund managers regarding the stock’s future performance.
NEM Analyst Ratings
The analyst ratings for NEM have shown a generally positive trend, with a notable number of upgrades recently. Currently, there are 2 strong buy ratings, 9 buy ratings, 7 hold ratings, and no sell or strong sell ratings. This indicates a favorable outlook among analysts. 🟢 The recent upgrades from Argus Research and Scotiabank, moving from hold to buy and from sector perform to sector outperform respectively, further bolster this positive sentiment.
In the past month, the distribution of ratings reflects a bullish sentiment, with a total of 3 strong buy ratings, 11 buy ratings, and only 1 sell rating. This suggests that analysts are optimistic about NEM’s performance moving forward.
Looking ahead, the stock is likely to perform well in the next month, with a forecasted price increase of approximately 5-10% based on the current analyst sentiment and market conditions. However, the medium confidence level indicates that while the outlook is positive, there are still some uncertainties in the market that could affect performance.
NEM Economic Analysis
Based on the US economic and market data:
🔴 The **unemployment rate** has increased to **4.3%**, up from **4.1%** in June, indicating a potential slowdown in the labor market which could negatively impact consumer spending and overall economic growth.
🟡 **Retail sales** have shown a slight increase to **627,510**, but this is not substantial enough to indicate strong consumer confidence.
🟢 The **GDP** growth rate remains stable at **5737.189**, suggesting that the economy is not in recession, which is a positive sign for companies like Newmont Corporation.
🔴 The **CPI** remains high at **314.540**, indicating persistent inflationary pressures that could lead to increased operational costs for Newmont.
🟢 The **gold prices** are generally supported by inflation, and with the current economic uncertainty, gold remains a safe haven, which could benefit Newmont’s revenue in the coming month.
Overall, while there are some positive indicators, the increase in unemployment and persistent inflation create a mixed outlook for Newmont Corporation’s stock price in the next month. The price may fluctuate between **51.00 and 55.00**, with a potential target of **54.00** based on analyst recommendations.
Disclaimer
Investors may consider the AI predictions and news summaries as one factor in their investment decisions alongside their own research and risk tolerance.

