XOM Stock Analysis: A Mixed Bag of Opportunities and Risks
🔴 Recommendation: Exxon Mobil Corporation (XOM) is currently rated as a sell, reflecting a cautious stance amid a backdrop of mixed momentum and trend signals.
📈 Key Highlights:
Financial Health: Strong net income of $9.24 billion and an impressive operating margin of 100.00% indicate robust profitability and operational efficiency.
Growth Potential: Year-over-year revenue growth of 11.91% and earnings growth of 10.40% suggest a positive trajectory for future performance.
Valuation Metrics: A forward P/E ratio of 12.13 points to potential undervaluation, making XOM an attractive option relative to its earnings.
⚠️ Caution Flags:
Liquidity Concerns: A current ratio of 0.80 raises red flags about the company’s ability to meet short-term obligations.
Market Sentiment: Despite positive developments, such as Mitsubishi Corp’s interest in acquiring a stake in XOM’s Texas project, the stock has recently dipped amidst broader market gains.
As we delve deeper into the analysis, we will explore the price trends, technical indicators, financial health, valuation metrics, and recent developments surrounding XOM to provide a comprehensive overview of its current standing and future outlook. Let’s dive into the details as we break down the complexities of Exxon Mobil’s stock performance 👇
XOM Price Analysis
| Positive Momentum Signals | Negative Momentum Signals | Hold Momentum Signals |
|---|---|---|
|
|
|
| Positive Trend Signals | Negative Trend Signals | Hold Trend Signals |
|---|---|---|
|
|
|
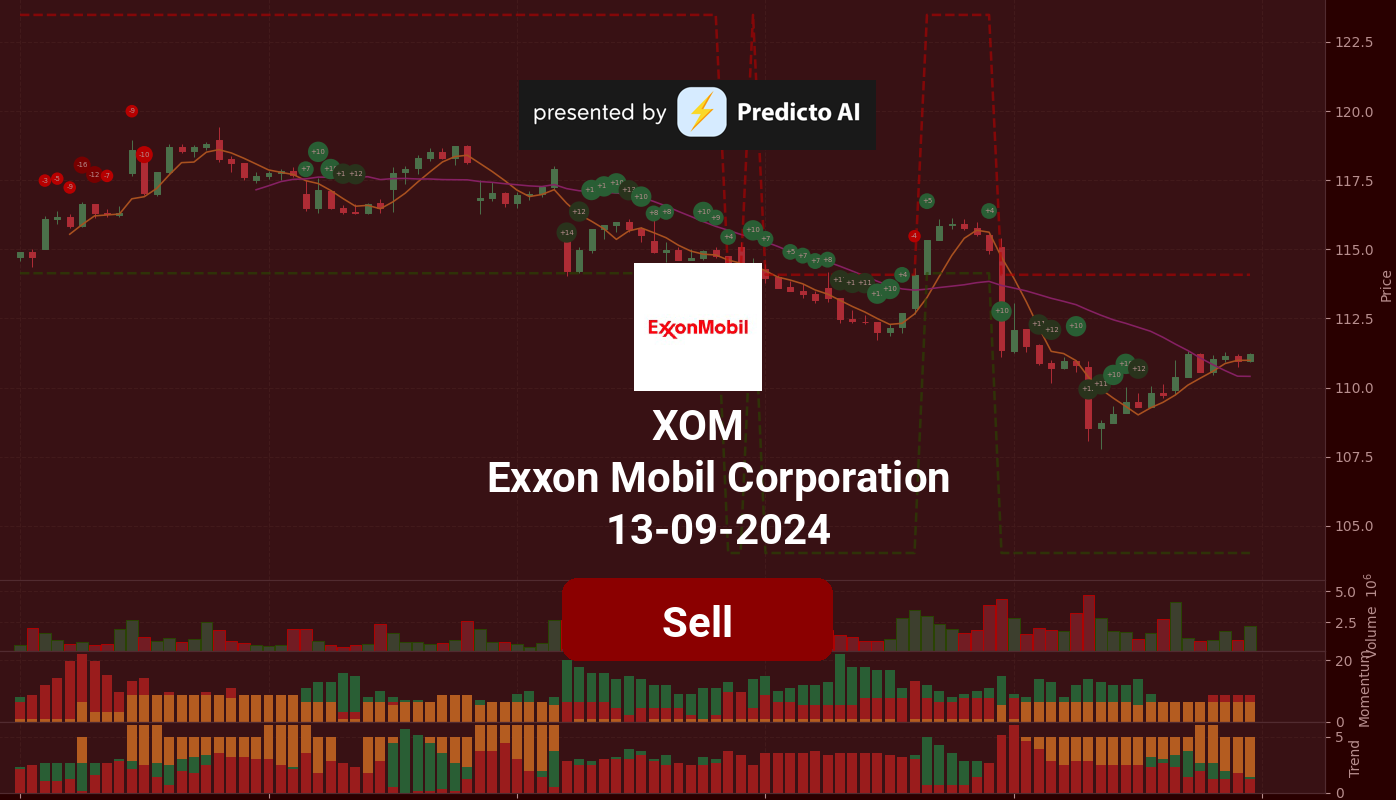
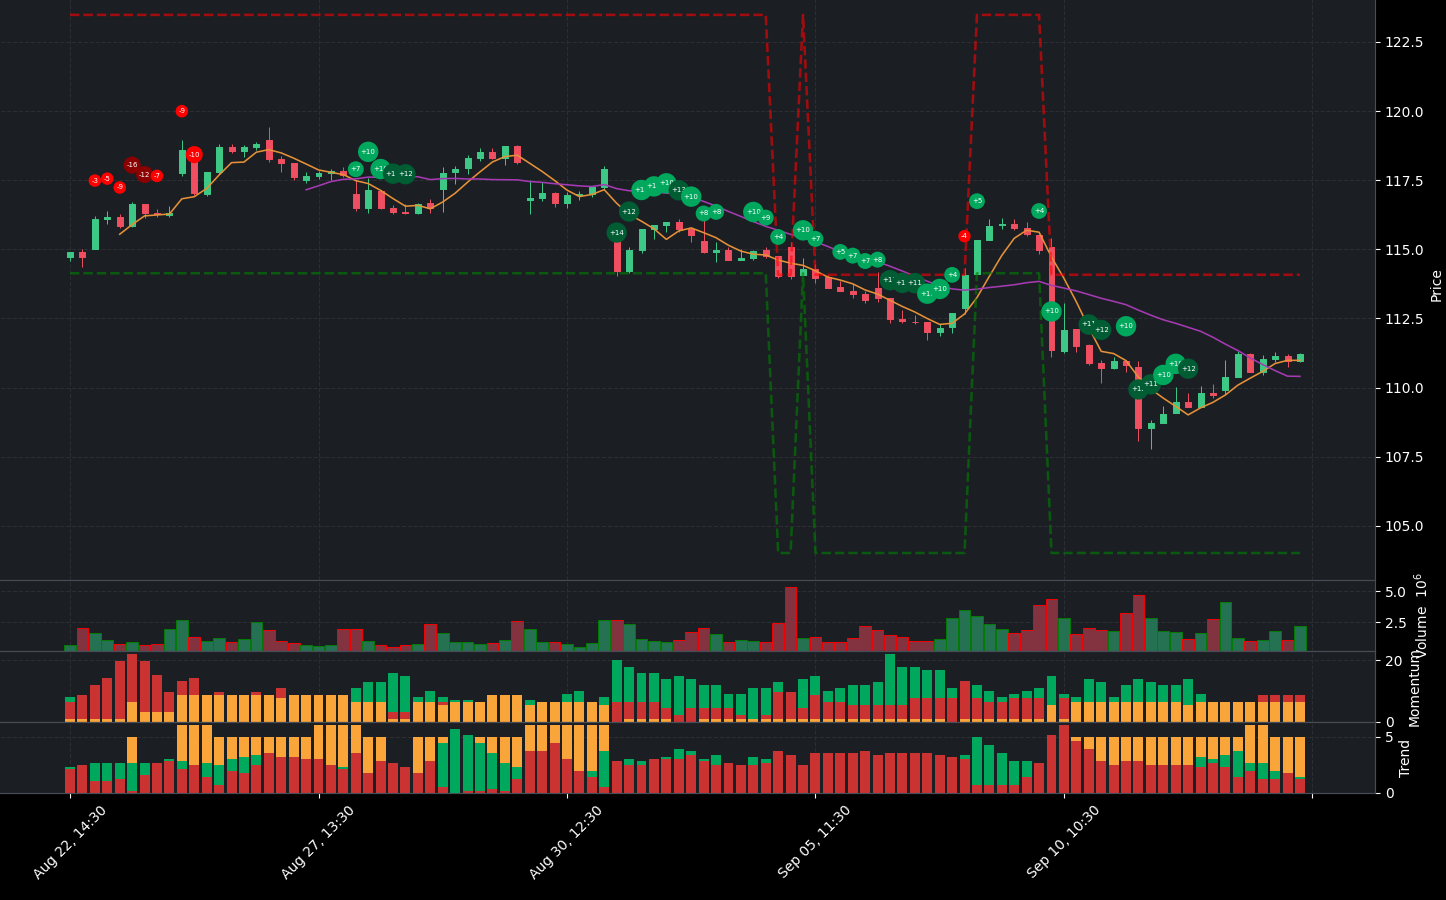
Exxon Mobil Corporation (XOM) presents a complex financial picture, characterized by both positive and negative indicators. Currently, the stock is rated as a sell, reflecting caution in the face of mixed momentum and trend signals.
On the positive side, there are signs of potential recovery. The WaveTrend indicator suggests that the stock is oversold, indicating a possible bottom and a chance for upward movement. Additionally, the stock is trading above the 50-day EMA, which is a bullish signal, and the On-Balance Volume (OBV) is increasing, suggesting that buying pressure is building. The Supertrend indicator also confirms a bullish trend, with the price remaining above the Supertrend line.
However, these positive indicators are tempered by significant concerns. The StochRSI is currently overbought, which raises alarms about the sustainability of the recent price increases. Furthermore, the stock is trading below the 200-day EMA, indicating a bearish trend that is strengthening. This duality in trend indicators suggests that while there may be short-term opportunities, the long-term outlook remains precarious.
In summary, while XOM shows some potential for short-term gains, the overarching trend is bearish, and the stock’s current overbought condition could lead to a pullback. Investors should approach with caution, and a hold or sell recommendation is advisable until clearer signals of sustained growth emerge.
XOM Fundamental Analysis
XOM’s recent financial performance presents a compelling case for investment, characterized by strong profitability and growth potential, despite some notable concerns regarding liquidity and interest expenses.
The company’s net income for the most recent period was a robust $9.24 billion, reflecting strong profitability. Furthermore, the year-over-year increase in net income is a positive indicator for future performance. XOM boasts an impressive operating margin of 100.00%, showcasing exceptional operational efficiency and cost control. However, it is important to note that the net interest income is negative at -$271 million, suggesting that the company is currently paying more in interest than it earns on its assets. Additionally, a current ratio of 0.80 raises potential liquidity concerns, indicating that the company may face challenges in meeting its short-term obligations.
From a valuation perspective, XOM appears to be potentially undervalued with a forward P/E ratio of 12.13, suggesting that the stock may be a good buy relative to its earnings. The price-to-sales ratio of 1.43 further supports this notion, indicating that the stock is reasonably priced compared to its revenue.
In terms of growth and profitability, XOM demonstrates strong potential with a revenue growth rate of 11.91% year-over-year. This growth is likely to positively impact the stock price moving forward. The company’s net profit margin of 10.27% reflects its ability to generate profits after all expenses, reinforcing its strong profitability. Additionally, an earnings growth rate of 10.40% indicates a positive trajectory for future earnings.
Regarding shareholder information, XOM maintains an average of 4.06 billion ordinary shares outstanding, indicating stability in its shareholder base. The company has also engaged in significant stock repurchases amounting to $8.37 billion, which can signal management’s confidence in the company’s future prospects.
Examining the income statement, XOM reported total revenue of $89.99 billion, showcasing strong sales performance. The previously mentioned operating margin of 100.00% further emphasizes the company’s operational efficiency.
On the balance sheet, the average net debt of $10.06 billion warrants further investigation into its impact on financial flexibility. However, a debt-to-equity ratio of 0.19 suggests a moderate level of leverage, which may be sustainable given the company’s profitability. The cash to total assets ratio of 0.08 indicates limited financial flexibility, which could pose concerns during economic downturns.
In terms of cash flow, XOM demonstrates strong financial health with an average free cash flow of $29.00 billion, providing ample cash for investments, debt reduction, or dividends. The average capital expenditures of $17.42 billion indicate ongoing investments in growth and expansion. Additionally, a positive net cash from financing of $38.30 billion suggests that the company is raising capital, which could be utilized for growth or debt reduction.
Overall, the financial indicators suggest that XOM is in a strong position with solid profitability, growth potential, and reasonable valuation metrics. However, investors should remain aware of the liquidity and interest expense concerns. Given the overall analysis, XOM is recommended as a buy for those looking to invest in a financially sound company with promising growth prospects.
Financial Health
🟢 Net Income for the most recent period was positive at $9.24 billion, indicating strong profitability.
🟢 Year-over-year net income increased, which is a positive sign for future performance.
🟢 Operating Margin of 100.00% suggests highly efficient operations and excellent cost control.
🔴 Net Interest Income is negative at -$271 million, indicating the company is paying more in interest than it earns on its assets.
🔴 Current Ratio of 0.80 suggests potential liquidity risk, as the company may struggle to meet short-term obligations.
Valuation
🟢 Forward P/E ratio of 12.13 indicates potential undervaluation, suggesting the stock may be a good buy relative to its earnings.
🟢 Price-to-Sales Ratio of 1.43 is reasonable, indicating the stock is not overly expensive compared to its revenue.
Growth and Profitability
🟢 Revenue Growth of 11.91% year-over-year indicates strong growth potential, which may positively impact the stock price.
🟢 Net Profit Margin of 10.27% reflects the company’s ability to generate profits after all expenses, which is a strong indicator of profitability.
🟢 Earnings Growth of 10.40% suggests the company is on a positive trajectory for future earnings.
Shareholder Information
🟢 Average Ordinary Shares Outstanding is 4.06 billion, indicating a stable number of shares held by investors.
🟢 Stock Repurchases of $8.37 billion can signal management’s confidence in the company’s future prospects.
Income Statement
🟢 Total Revenue for the most recent period was $89.99 billion, showing strong sales performance.
🟢 Operating Margin of 100.00% indicates exceptional operational efficiency.
Balance Sheet
🔴 Average Net Debt of $10.06 billion warrants further investigation into its impact on financial flexibility.
🟢 Debt-to-Equity Ratio of 0.19 suggests a moderate level of leverage, which may be sustainable given the company’s profitability.
🔴 Cash to Total Assets Ratio of 0.08 indicates limited financial flexibility, which could be a concern during economic downturns.
Cashflow
🟢 Average Free Cash Flow of $29.00 billion indicates the company has cash available for investments, debt reduction, or dividends.
🟢 Average Capital Expenditures of $17.42 billion suggests the company is investing in growth and expansion.
🟢 Positive Net Cash from Financing of $38.30 billion indicates the company is raising capital, which could be used for growth or debt reduction.
Overall, the financial indicators suggest that XOM is in a strong position with solid profitability, growth potential, and reasonable valuation metrics, despite some concerns regarding liquidity and interest expenses.
XOM News Analysis
Recent developments regarding Exxon Mobil (XOM) indicate a generally positive outlook for the company, particularly with Mitsubishi Corp’s interest in acquiring a stake in its Texas project. However, some mixed signals from market performance and legal challenges may temper enthusiasm.
Summary of XOM news reveals a favorable scenario for investors. The potential stake acquisition by Mitsubishi Corp and the bullish sentiment from hedge funds are strong indicators of confidence in XOM’s future. However, the company’s recent stock dip amidst market gains and ongoing legal issues could pose risks. Investors should weigh these factors carefully.
🟢 Mitsubishi Corp. is in talks to buy a stake in Exxon Mobil’s Texas project, which could enhance XOM’s operational capacity and market position.
🟢 The deal may lead to increased investment and collaboration, benefiting both companies.
🟢 Japan’s Mitsubishi plans to buy a stake and offtake ammonia from ExxonMobil, indicating strong international interest in XOM’s projects.
🔴 ExxonMobil’s CEO has vowed legal action against proxy rule abusers, highlighting ongoing governance challenges that could distract from operational focus.
🟢 Analyst reports suggest that hedge fund sentiment towards XOM is bullish, reflecting confidence in the company’s long-term prospects.
🔴 Despite this, XOM’s stock has dipped while the market has gained, suggesting some investor caution or profit-taking.
🟢 A report indicates that oil stocks, including Exxon, may bounce back, with potential for XOM to jump more than 20%, which could attract new investors.
🔴 Berkshire Hathaway’s struggles with Occidental Petroleum may indirectly affect sentiment towards XOM, as investors reassess their positions in the sector.
XOM Holders Analysis
The financial health of XOM presents a mixed outlook for the next month, leading to a neutral recommendation. While there are positive indicators, some concerns warrant caution.
🟢 XOM has a **high institutional ownership** at **64.75%**, indicating strong interest from large investors, which typically supports stock stability and growth. This level of institutional backing can provide a buffer against volatility.
🟡 The **very low insider ownership** at **0.05%** raises concerns about management’s confidence in the company’s future. This could suggest a lack of alignment between management and shareholder interests, which is a potential red flag.
🟢 The **number of institutional holders** is substantial at **4659**, indicating a diversified ownership structure that can help mitigate risks associated with any single investor’s actions.
🔴 Recent **insider transactions** show minimal purchases and some sales, which may reflect a cautious sentiment among insiders. The lack of significant insider buying could indicate that those closest to the company do not foresee immediate positive changes.
🟡 The **insider purchases** over the last six months are relatively low compared to sales, with only **79,075 shares purchased** against **4,826 shares sold**. This imbalance suggests that insiders may not be overly optimistic about the stock’s near-term performance.
XOM Analyst Ratings
The analyst ratings for XOM show a mixed sentiment, with a total of 2 strong buy ratings, 5 buy ratings, 11 hold ratings, 5 sell ratings, and 2 strong sell ratings over the last month. This indicates a cautious optimism among analysts. 🟡 The recent upgrades from firms like UBS and Wells Fargo, which maintain their buy and overweight ratings respectively, suggest that there is potential for growth. However, the presence of a significant number of hold and sell ratings indicates that some analysts are wary of potential market fluctuations.
🟢 In the past month, the overall sentiment has been relatively stable, with no drastic changes in recommendations. Given the current analyst outlook and the recent upgrades, it is likely that XOM will see moderate performance over the next month, potentially in the range of 2-5% increase in stock price, barring any major market disruptions. However, the medium confidence level suggests that investors should remain vigilant and consider market conditions.
XOM Economic Analysis
Based on the US economic and market data:
🔴 The unemployment rate has increased to 4.3%, up from 4.1% in the previous month, indicating potential weakness in the labor market which could lead to reduced consumer spending.
🟡 Retail sales have shown a slight increase to 627,510, but the growth is not substantial enough to indicate strong consumer confidence.
🟢 The GDP growth remains stable at 5737.189, suggesting that the economy is not in a recession, which is a positive sign for overall market stability.
🔴 The increase in Non-Farm Payrolls is marginal, which may not be sufficient to drive significant economic growth or boost energy demand.
🟡 The CPI remains high at 314.540, indicating persistent inflationary pressures that could lead to tighter monetary policy, affecting overall market sentiment negatively.
Overall, the mixed signals from the economic indicators suggest that while Exxon Mobil has a solid business model and is involved in essential sectors, the current economic environment presents challenges that could limit significant price appreciation in the near term. The stock may remain within a range of 110 to 115 over the next month, with potential volatility depending on broader market movements and oil price fluctuations.
Disclaimer
Investors may consider the AI predictions and news summaries as one factor in their investment decisions alongside their own research and risk tolerance.

