Duke Energy Corporation (DUK) Stock Analysis: Caution Advised!
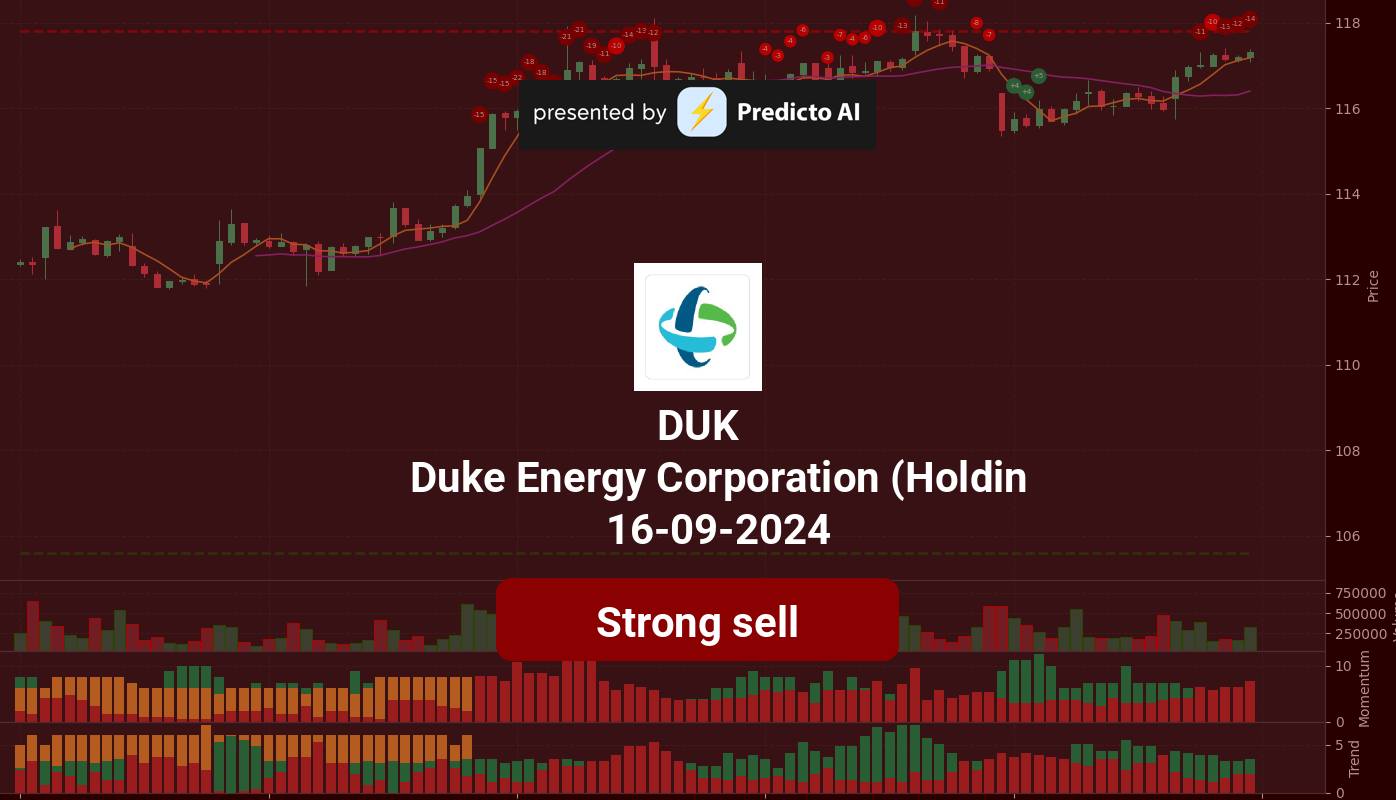
🔴 Recommendation: DUK is currently rated a strong sell, reflecting significant concerns about its future performance with 12 negative indicators outweighing just 5 positives.
📈 Key Highlights:
Financial Health: Recent net income of $910 million shows a troubling year-over-year decline, raising questions about future profitability.
Revenue Trends: Total revenue has decreased by 6.51%, indicating a downward trajectory that could negatively impact stock price.
Debt Levels: A high Debt-to-Equity Ratio of 2.90 raises serious concerns about financial risk and the company’s ability to weather economic downturns.
⚠️ Caution Flags:
Liquidity Issues: A critically low Current Ratio of 0.09 suggests severe liquidity risks, complicating the company’s ability to meet short-term obligations.
Negative Cash Flow: Free Cash Flow is negative at -$2.72 billion, indicating potential difficulties in funding operations and growth initiatives.
Overbought Conditions: Momentum indicators show that DUK is currently overbought, suggesting a potential price correction may be on the horizon.
As we delve deeper into the analysis, we will explore the price trends, technical indicators, financial health, valuation metrics, and the latest news surrounding Duke Energy to provide a comprehensive overview of this utility giant. Stay tuned for more insights! 👇
DUK Price Analysis

| Positive Momentum Signals | Negative Momentum Signals | Hold Momentum Signals |
|---|---|---|
|
|
| Positive Trend Signals | Negative Trend Signals | Hold Trend Signals |
|---|---|---|
|
|
|
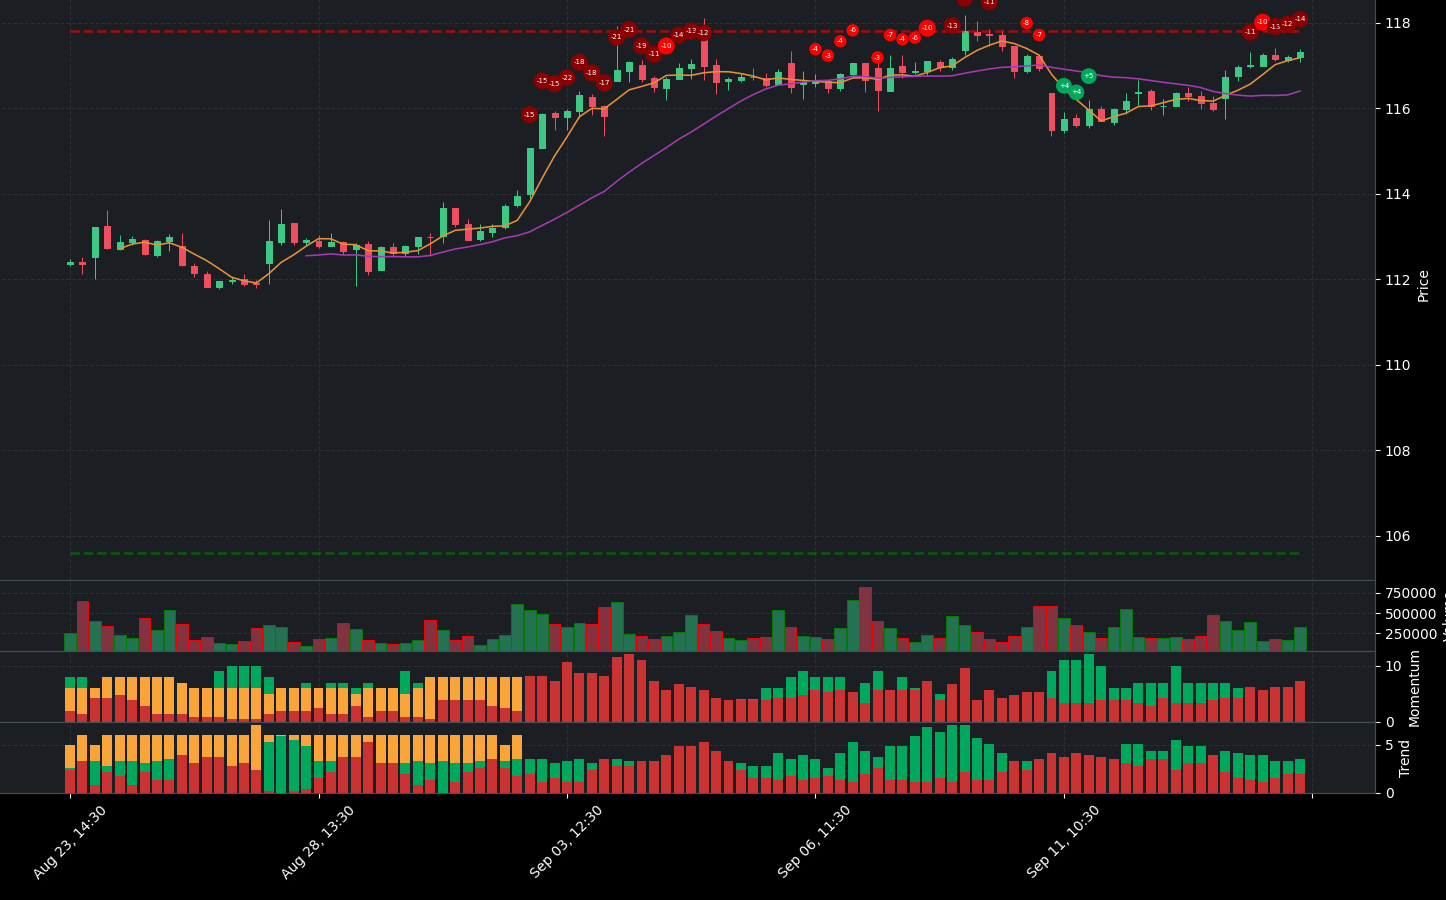
Duke Energy Corporation (DUK) presents a complex financial picture that leans towards caution for potential investors. Currently, the stock is rated a strong sell, indicating significant concerns about its future performance.
On the momentum front, several negative indicators are present. The Money Flow Index (MFI) shows a bearish divergence, suggesting that despite recent price increases, underlying buying pressure may be weakening. Additionally, the Stochastic Relative Strength Index (StochRSI) indicates that the stock is overbought and also exhibits a bearish divergence, which could signal a potential price correction. Furthermore, the stock’s position is closer to resistance, adding to the risk of a downturn.
Despite these negative momentum indicators, there are some positive trends worth noting. The stock price is currently above the 50-day and 200-day Exponential Moving Averages (EMAs), which typically indicates a bullish trend. The On-Balance Volume (OBV) is increasing, supported by high volume, suggesting that the stock has seen strong buying interest. Additionally, the price is above the Supertrend indicator, reinforcing the notion of a bullish trend, albeit with caution due to the overbought conditions.
However, the proximity to resistance remains a significant concern, as it could limit further upside potential and increase the likelihood of a price pullback.
In summary, while Duke Energy shows some bullish trends, the overwhelming negative momentum indicators and the strong sell recommendation suggest that investors should approach this stock with caution. A sell or strong sell stance is advisable until clearer signs of recovery and stability emerge in the market.
DUK Fundamental Analysis
DUK’s recent financial performance raises significant concerns for potential investors. The company reported a net income of $910 million for the most recent period; however, the year-over-year trend shows a troubling decrease, which casts doubt on future profitability. Additionally, total revenue has declined by 6.51% year-over-year, further indicating a downward trajectory that could negatively impact stock price.
The financial health of DUK is alarming, highlighted by an extremely high debt-to-equity ratio of 2.90. This level of leverage raises serious questions about the company’s ability to withstand economic downturns. Compounding this issue is a critically low current ratio of 0.09, suggesting severe liquidity risks and challenges in meeting short-term obligations. Furthermore, the cash to total assets ratio stands at 0.00, indicating limited financial flexibility and vulnerability to economic shocks.
Valuation metrics also suggest potential overvaluation of the stock. The price-to-sales ratio is 3.06, and the forward P/E ratio of 18.53 indicates that the stock may be priced high relative to its earnings potential. While the net profit margin of 12.69% appears strong, it is overshadowed by the declining revenues and negative free cash flow of -$2.72 billion, which raises concerns about the company’s ability to fund operations and growth initiatives.
Shareholder information reveals further red flags, including average dilution of earnings per share, which indicates potential erosion of shareholder value. High levels of debt and negative cash flow could lead to reduced investor confidence and lower stock performance.
The income statement reflects a concerning year-over-year revenue growth of -6.51%, which is alarming and indicates a downward trend in sales. The decline in net income raises additional red flags about the company’s ability to maintain profitability moving forward.
On the balance sheet, average net debt of $79.62 billion is substantial and warrants further investigation into its impact on financial flexibility. The high debt-to-equity ratio of 164.10 indicates significant financial leverage and potential risk, while the current ratio of 0.09 suggests critical liquidity issues.
Cash flow analysis reveals average capital expenditures of $10.90 billion, indicating investment in growth; however, the negative free cash flow raises concerns about the sustainability of these investments. Negative cash flow from operations could limit the company’s ability to fund future growth and pay down debt.
Overall, the combination of declining revenues, high debt levels, and liquidity issues strongly suggests that DUK is not in a favorable position for investment at this time. Investors should exercise caution and thoroughly evaluate the company’s ability to navigate its challenges before considering any investment.
Financial Health
🔴 Net Income for the most recent period was $910 million, but the year-over-year net income trend shows a decrease, raising concerns about future profitability.
🔴 Total Revenue for the most recent period was $7.17 billion, with a year-over-year revenue growth of -6.51%, indicating a decline that could negatively impact stock price.
🔴 The Debt-to-Equity Ratio is extremely high at 2.90, which raises significant concerns about financial risk and the company’s ability to withstand economic downturns.
🔴 The Current Ratio is critically low at 0.09, suggesting severe liquidity risk and challenges in meeting short-term obligations.
🔴 Cash to Total Assets Ratio is 0.00, indicating limited financial flexibility and vulnerability to economic shocks.
Valuation
🔴 Price-to-Sales Ratio is 3.06, suggesting potential overvaluation of the stock.
🔴 The forward P/E ratio of 18.53 indicates that the stock may be priced high relative to its earnings potential.
Growth and Profitability
🔴 Operating Margin is 100.00%, which is misleading given the overall financial context; however, the Net Profit Margin of 12.69% is strong but overshadowed by declining revenues.
🔴 Free Cash Flow is negative at -$2.72 billion, indicating potential difficulties in funding operations and growth initiatives.
Shareholder Information
🔴 The average dilution of earnings per share is concerning, as it indicates potential shareholder value erosion.
🔴 High levels of debt and negative cash flow could lead to reduced investor confidence and lower stock performance.
Income Statement
🔴 Year-over-year revenue growth of -6.51% is alarming, indicating a downward trend in sales.
🔴 The decline in net income raises red flags about the company’s ability to maintain profitability in the future.
Balance Sheet
🔴 Average Net Debt is $79.62 billion, which is substantial and warrants further investigation into its impact on financial flexibility.
🔴 The high Debt-to-Equity Ratio of 164.10 indicates significant financial leverage and potential risk.
🔴 The Current Ratio of 0.09 suggests a critical liquidity issue, making it difficult for the company to meet its short-term obligations.
Cashflow
🔴 Average Capital Expenditures of $10.90 billion indicate investment in growth, but the negative free cash flow raises concerns about the sustainability of these investments.
🔴 Negative cash flow from operations could limit the company’s ability to fund future growth and pay down debt.
Overall, the combination of declining revenues, high debt levels, and liquidity issues strongly suggests that DUK is not in a favorable position for investment at this time.
DUK News Analysis
DUK News: A mixed outlook for investors.
Duke Energy Corporation (DUK) presents a mixed outlook for investors based on recent news. While there are positive developments regarding rate agreements and community support initiatives, the overall impact on stock performance remains uncertain. Investors should weigh these factors carefully.
🟢 Duke Energy’s subsidiary, Piedmont, has reached a deal to raise rates, which could enhance revenue stability.
🔴 However, the rate increase may face scrutiny from consumers and regulators, potentially leading to backlash.
🟢 Piedmont Natural Gas has successfully negotiated a rate case agreement with key consumer and industrial groups in North Carolina, indicating a collaborative approach to rate adjustments.
🟢 Duke Energy has outperformed the broader market, suggesting strong operational performance relative to peers.
🟢 The company is highlighted as a passive income winner, appealing to income-focused investors.
🟢 Duke Energy Foundation’s $100,000 grant for senior home ramp programs in South Carolina demonstrates corporate social responsibility and community engagement.
🟢 Additionally, a $200,000 grant to bolster Florida’s economy reflects Duke’s commitment to regional development.
🟢 The foundation’s investments exceeding $19.5 million in disaster readiness and recovery indicate a proactive approach to community resilience.
🔴 Concerns about Duke Energy’s return on equity (ROE) may raise questions about its long-term profitability and efficiency.
DUK Holders Analysis
The financial health of DUK shows a mixed outlook, with both positive and negative indicators that suggest a cautious approach for the next month.
🟢 DUK has a high institutional ownership at **66.72%**, indicating strong interest from large investors, which typically provides stability and confidence in the stock’s performance. This level of institutional backing can help buffer against market volatility.
🟡 The insider ownership is very low at **0.14%**, which may indicate a lack of confidence from company management or a high degree of external control. This could raise concerns about the alignment of interests between management and shareholders.
🟡 The number of institutional holders is substantial at **2377**, suggesting a diversified ownership base. This can be a positive sign as it indicates widespread interest and support for the company.
🔴 Recent insider transactions show a higher number of sales compared to purchases, which could signal a lack of confidence among insiders regarding the company’s short-term prospects. The net insider activity over the last six months shows more selling than buying, which is a red flag.
🔴 The stock has faced some downward pressure in recent months, and while institutional support is strong, the low insider ownership and mixed transaction activity suggest caution.
DUK Analyst Ratings
The analyst ratings for DUK show a mixed sentiment, with a total of 1 strong buy, 8 buy, 12 hold, 2 sell, and 1 strong sell over the last three months. This indicates a predominance of hold ratings, suggesting that analysts are not overly bullish on the stock at this time. The recent upgrades from RBC Capital to Outperform and Keybanc to Overweight are positive signals, but they are countered by the overall cautious stance reflected in the hold ratings from other firms.
🟡 In the past month, the distribution of ratings indicates that while there are some positive outlooks, the majority of analysts are recommending a hold, reflecting uncertainty in the stock’s performance.
🔴 Given the mixed analyst sentiment and the predominance of hold ratings, it is likely that DUK will experience limited movement in the next month, with a forecasted price range of approximately $95 to $100. The medium confidence level suggests that while there are some positive indicators, investors should remain cautious.
DUK Economic Analysis
Based on the US economic and market data:
🟢 The recent **unemployment rate** has increased slightly to **4.3%**, but it remains relatively low, indicating a stable labor market which supports consumer spending. This is generally positive for utility companies like Duke Energy, as stable employment can lead to consistent demand for electricity.
🟢 **Retail sales** have shown an increase to **627,510**, suggesting that consumer spending is robust. Higher retail sales can lead to increased energy consumption, benefiting Duke Energy’s revenue.
🔴 The **CPI** remains high at **314.540**, indicating persistent inflation. This could lead to increased operational costs for Duke Energy, which may pressure profit margins if they cannot pass these costs onto consumers.
🟡 The **GDP** growth rate is stable, but the recent figures do not indicate significant acceleration. A stable GDP growth of **5737.189** suggests that while the economy is not in decline, it is also not experiencing rapid growth, which could limit Duke Energy’s expansion opportunities.
🟢 The **dividend yield** of **3.56%** is attractive for income-focused investors, and the company has a history of paying dividends, which can provide a cushion against market volatility.
Overall, while there are some concerns regarding inflation and its impact on costs, the stable labor market and increasing retail sales provide a positive backdrop for Duke Energy. The stock is currently trading at **117.31**, with a target mean price of **117.45**, suggesting limited upside in the short term but still a favorable investment for income-seeking investors.
Disclaimer
Investors may consider the AI predictions and news summaries as one factor in their investment decisions alongside their own research and risk tolerance.


