Ford Motor Company (F) Stock Analysis: A Mixed Outlook Ahead!
🔴 Recommendation: Ford is currently rated as a buy, but investors should proceed with caution due to a blend of positive and negative indicators that shape the stock’s future.
📈 Key Highlights:
Momentum Indicators: The stock is showing signs of being oversold, with momentum indicators like Stochastic RSI and WaveTrend suggesting a potential rebound opportunity.
Financial Health: Despite a net income of $1.83 billion, concerns arise from a low net profit margin of 3.83% and a high debt-to-equity ratio of 3.43.
Growth Potential: Year-over-year revenue growth of 11.76% indicates strong sales performance, although earnings growth is currently negative at -2.20%.
⚠️ Caution Flags:
Bearish Trends: The stock price is below both the 50-day and 200-day EMA, indicating a strengthening bearish trend.
Liquidity Risks: A low current ratio of 0.39 raises concerns about Ford’s ability to meet short-term obligations.
Market Sentiment: The auto industry is facing significant challenges, including guidance cuts from competitors and external economic pressures.
As we delve deeper into the analysis, we will explore the price trends, indicators, financial health, valuation metrics, and more to provide a comprehensive view of Ford’s stock outlook. Stay tuned for the details below! 👇
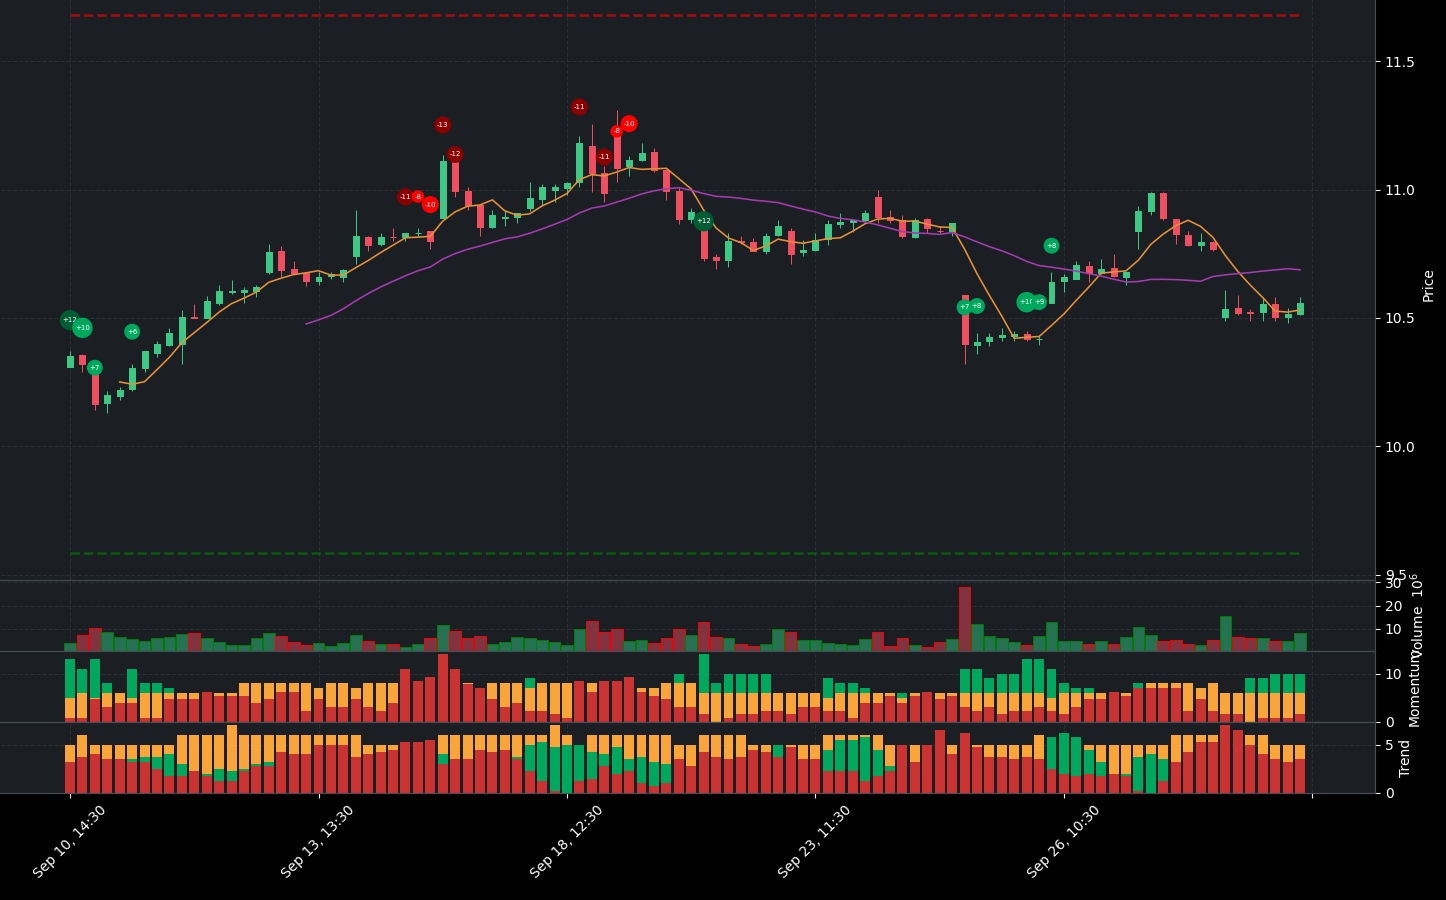
F Price Analysis

| Positive Momentum Signals | Negative Momentum Signals | Hold Momentum Signals |
|---|---|---|
|
|
|
| Positive Trend Signals | Negative Trend Signals | Hold Trend Signals |
|---|---|---|
|
|
|
Ford Motor Company (F) presents a complex financial picture, characterized by both opportunities and risks. Currently, the stock is rated as a buy, indicating potential for upside despite the prevailing challenges.
On the positive side, momentum indicators suggest that the stock is oversold, with both the Stochastic RSI and WaveTrend signaling a potential bottom. This could present a buying opportunity for investors looking to capitalize on a rebound. Additionally, trend indicators are showing some encouraging signs: the On-Balance Volume (OBV) is increasing with high volume, and the MACD has recently experienced a positive histogram crossover, which typically indicates bullish momentum.
However, caution is warranted due to several negative indicators. The stock price is currently below the 50-day and 200-day EMA, indicating a bearish trend that is strengthening. Furthermore, the price is situated below the middle band of its Bollinger Bands, suggesting it is in a downtrend, albeit in oversold conditions. The Supertrend indicator also confirms a bearish trend, as the price remains below the Supertrend line.
Given these mixed signals, investors should approach Ford with a balanced perspective. While the oversold conditions and positive momentum indicators may suggest a potential rebound, the prevailing bearish trends and negative momentum indicators indicate that the stock could face further challenges in the near term. Therefore, a hold or cautious buy recommendation is advisable, with close monitoring of market conditions and momentum shifts.
F Fundamental Analysis
F’s recent financial performance presents a mixed picture, highlighting both potential and significant risks. The company reported a net income of $1.83 billion, which is a positive sign; however, the low net profit margin of 3.83% raises concerns about its overall profitability.
The financial leverage is notably high, with a debt-to-equity ratio of 3.43, indicating substantial reliance on debt financing, which could pose risks in adverse economic conditions. Additionally, the current ratio stands at a low 0.39, suggesting potential liquidity issues and challenges in meeting short-term obligations. The cash to total assets ratio is also low at 0.09, reflecting limited financial flexibility and increased vulnerability to economic shocks.
On the valuation front, the forward P/E ratio of 5.53 suggests that the stock may be undervalued relative to its earnings potential. However, the price-to-sales ratio of 0.24, while indicating possible undervaluation, also points to inefficiencies in revenue generation.
In terms of growth and profitability, F has shown a year-over-year revenue growth of 11.76%, indicating strong growth potential that could positively influence the stock price. Conversely, the negative earnings growth of -2.20% raises concerns about the company’s ability to sustain profitability moving forward. The operating margin is low at 4.31%, suggesting operational inefficiencies that need to be addressed.
From a shareholder perspective, the company has generated positive net cash from financing activities amounting to $98.31 billion, indicating that it is raising capital, which could be directed towards growth initiatives or debt reduction. However, the modest stock repurchases of $204.75 million suggest limited confidence in enhancing shareholder value.
Examining the income statement, total revenue for the most recent period was a robust $47.81 billion, yet the net profit margin of 2.13% indicates ongoing challenges in cost control and profit generation. The operating margin of 100.00% appears inconsistent with the low net profit margin, warranting further investigation.
On the balance sheet, the average net debt is high at $123.62 billion, which raises concerns about financial flexibility. The average total debt of $148.96 billion further complicates the company’s ability to service its debt obligations. However, the average tangible book value of $43.43 billion suggests a solid net worth after liabilities.
Cash flow analysis reveals a negative free cash flow of -$1.23 billion, raising alarms about the company’s capacity to fund operations and invest in growth. Nevertheless, the average capital expenditures of $6.77 billion indicate that the company is still investing in growth and expansion.
In summary, while F exhibits some positive indicators such as revenue growth and capital raising activities, the high debt levels, low profit margins, and liquidity concerns suggest a cautious approach to investing in this stock. Investors should carefully consider these factors and the company’s ability to navigate its financial challenges before making any investment decisions.
Financial Health
🔴 Net Income for the most recent period was $1.83 billion, which is positive but the low net profit margin of 3.83% raises concerns about profitability.
🔴 The Debt-to-Equity Ratio is high at 3.43, indicating significant financial leverage and potential risk.
🔴 Current Ratio is low at 0.39, suggesting potential liquidity risk and challenges in meeting short-term obligations.
🔴 Cash to Total Assets Ratio is low at 0.09, indicating limited financial flexibility and vulnerability to economic shocks.
Valuation
🟢 Forward P/E ratio of 5.53 suggests the stock may be undervalued relative to its earnings potential.
🔴 Price-to-Sales Ratio is low at 0.24, which could indicate undervaluation but also reflects low revenue generation efficiency.
Growth and Profitability
🟢 Year-over-year revenue growth of 11.76% indicates strong growth potential, which may positively impact the stock price.
🔴 Earnings growth is negative at -2.20%, indicating potential challenges in sustaining profitability.
🔴 Operating Margin is low at 4.31%, reflecting inefficiencies in operations.
Shareholder Information
🟢 Positive net cash from financing activities at $98.31 billion indicates the company is raising capital, which could be used for growth or debt reduction.
🔴 Stock repurchases of $204.75 million are modest, suggesting limited confidence in boosting share value.
Income Statement
🟢 Total revenue for the most recent period was $47.81 billion, showing strong sales performance.
🔴 Net profit margin of 2.13% is low, indicating challenges in controlling costs and generating profits.
🟢 Operating margin of 100.00% suggests efficient operations, but this figure seems inconsistent with the low net profit margin.
Balance Sheet
🔴 Average Net Debt is high at $123.62 billion, warranting further investigation into its impact on financial flexibility.
🔴 Average Total Debt of $148.96 billion raises concerns about the company’s ability to service its debt obligations.
🟢 Average Tangible Book Value of $43.43 billion indicates a solid net worth after liabilities.
Cashflow
🔴 Free Cash Flow is negative at -$1.23 billion, raising concerns about the company’s ability to fund operations and invest in growth.
🟢 Average Capital Expenditures of $6.77 billion suggest the company is investing in growth and expansion.
Overall, while there are some positive indicators such as revenue growth and capital raising activities, the high debt levels, low profit margins, and liquidity concerns suggest a cautious approach to investing in this stock.
F News Analysis
The news surrounding Ford (F) presents a mixed outlook for investors. While there are some positive initiatives, the overall sentiment is dampened by external pressures and negative market reactions.
Summary of Ford news indicates that the auto industry is facing significant challenges, particularly related to guidance cuts and exposure to China. Investors should weigh the potential benefits of Ford’s initiatives against the broader market pressures.
🔴 The auto industry is under pressure, which could negatively impact Ford’s performance.
🔴 Stellantis, a key competitor, has cut its guidance, leading to a negative ripple effect on Ford and GM stocks.
🔴 The warning from Stellantis has caused a decline in auto stocks, including Ford, indicating market volatility.
🟢 Ford is attempting to enhance its EV sales by offering free home chargers and installation, which could attract more customers.
🔴 The overall sentiment in the market remains cautious due to the EV slowdown and external economic pressures.
F Holders Analysis
The financial health of Ford (F) presents a mixed outlook for the next month, suggesting a neutral stance on the stock. While there are positive indicators, there are also concerns that warrant caution.
🟢 Ford has a **high institutional ownership** at 57.76%, indicating significant interest from large investors. This could provide stability and support for the stock price in the short term.
🟡 The **very low insider ownership** at 0.27% raises concerns about management’s confidence in the company’s future, which could affect investor sentiment negatively.
🟡 The **number of institutional holders** is substantial at 2035, suggesting a diversified ownership base, which can mitigate volatility.
🔴 Recent **insider transactions** show a higher number of sales compared to purchases, indicating potential lack of confidence from insiders.
🟡 The **insider purchases** over the last six months are relatively low compared to sales, which may reflect a cautious approach from management.
F Analyst Ratings
The analyst ratings for F (Ford Motor Company) show a mixed sentiment, with a significant number of hold ratings (18) and a moderate number of buy ratings (4). The recent downgrade by Morgan Stanley from Overweight to Equal-Weight indicates a cautious outlook.
🔴 In the past month, there have been 0 strong buy ratings, 4 buy ratings, 18 hold ratings, 2 sell ratings, and 0 strong sell ratings. This distribution suggests that while some analysts see potential, the majority are taking a wait-and-see approach.
🟡 Given the mixed ratings and the recent downgrade, it is likely that the stock will experience limited movement in the next month, with potential fluctuations around the current price level. The medium confidence level reflects the uncertainty in the market sentiment towards Ford.
F Economic Analysis
Based on the US economic and market data:
🔴 The unemployment rate has increased to 4.3%, up from 4.1% the previous month, indicating a potential slowdown in the labor market which could negatively impact consumer spending and, consequently, Ford’s vehicle sales.
🟡 Retail sales have shown a slight increase to 627,510, but this is not substantial enough to suggest strong consumer demand, especially in the context of rising unemployment.
🔴 The CPI remains high at 314.540, indicating persistent inflationary pressures that could lead to increased costs for Ford, affecting profit margins.
🟢 The GDP growth rate of 2.5% suggests a stable economy, which is generally positive for auto manufacturers like Ford, but the recent trends in unemployment and inflation may overshadow this.
🔴 The overall market sentiment appears cautious, with indices like NASDAQ and S&P 500 showing volatility, which could lead to investor hesitance in sectors like consumer cyclical, where Ford operates.
In summary, while there are some positive indicators, the negative trends in unemployment and inflation create a mixed outlook for Ford’s stock price over the next month. The price may fluctuate around the current level of 10.56, with potential support at the 10.48 level and resistance near 10.78.
Disclaimer
Investors may consider the AI predictions and news summaries as one factor in their investment decisions alongside their own research and risk tolerance.


