
NVIDIA Corporation (NVDA) Stock Analysis: A Mixed Yet Promising Outlook
🔵 Recommendation: NVDA presents a complex investment landscape with a cautious approach advised due to a mix of positive and negative indicators.
📈 Key Highlights:
Financial Performance: Strong net income of $16.60 billion and impressive year-over-year revenue growth of 15.34%.
Profitability: Operating margin of 100.00% and net profit margin of 55.26% showcase exceptional operational efficiency.
Growth Potential: Earnings growth of 168.00% and revenue growth of 122.40% indicate robust demand for NVIDIA’s products.
⚠️ Caution Flags:
Liquidity Concerns: Current ratio of 0.67 suggests potential challenges in meeting short-term obligations.
Decreasing Buying Pressure: A declining On-Balance Volume (OBV) raises questions about the sustainability of the current uptrend.
As we delve deeper into the analysis, we will explore the price trends, technical indicators, financial health, valuation metrics, and the latest news surrounding NVDA to provide a comprehensive view of this dynamic stock. Let’s dive into the details as we break down the various aspects influencing NVIDIA’s market position and future potential 👇
NVDA Price Analysis
| Positive Momentum Signals | Negative Momentum Signals | Hold Momentum Signals |
|---|---|---|
|
|
|
| Positive Trend Signals | Negative Trend Signals | Hold Trend Signals |
|---|---|---|
|
|
|
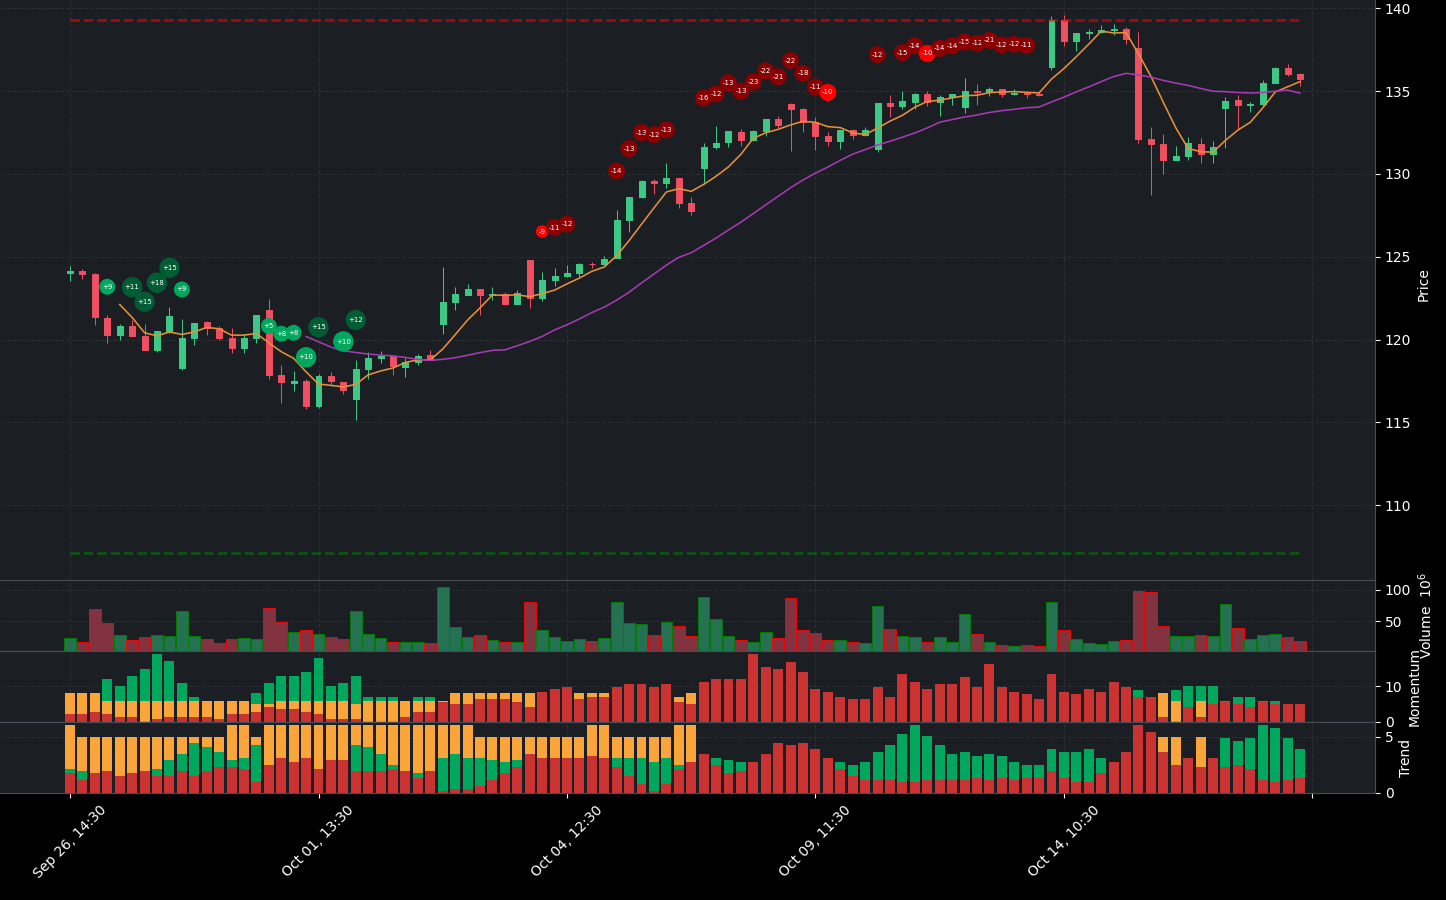
NVIDIA Corporation (NVDA) presents a complex investment landscape characterized by both positive and negative indicators. Currently, the stock price is in a neutral position, suggesting a cautious approach is warranted.
On the positive side, momentum indicators show a bullish divergence in the WaveTrend, indicating a potential reversal that could favor upward movement. Additionally, the stock is positioned above the 50-day and 200-day EMA, both of which are signs of a strengthening bullish trend. The price is also above the Supertrend, reinforcing the bullish sentiment. However, investors should be aware that the stock is closer to resistance, which could limit further gains.
Despite these positive trends, there are notable concerns. The On-Balance Volume (OBV) is decreasing, suggesting that the buying pressure may be waning. This, combined with the stock’s proximity to resistance, raises caution about the sustainability of the current uptrend.
Overall, while NVDA shows signs of a bullish trend, the decreasing OBV and position near resistance indicate that investors should proceed with caution. A hold recommendation may be prudent until clearer signals of sustained momentum emerge.
NVDA Fundamental Analysis
NVDA’s recent financial performance presents a compelling investment opportunity, characterized by strong profitability and significant growth potential. The company reported a remarkable net income of $16.60 billion for the most recent period, showcasing its robust profitability. Notably, the year-over-year increase in net income is a positive indicator for future performance. With an operating margin of 100.00%, NVDA demonstrates exceptional operational efficiency and cost control, while a net profit margin of 55.26% highlights its strong ability to generate profits after accounting for all expenses.
However, there are some concerns regarding its financial health. The average net debt of $3.71 billion warrants further investigation into its impact on financial flexibility. The debt-to-equity ratio of 0.30 indicates a moderate level of leverage, which is generally sustainable, but the current ratio of 0.67 suggests potential liquidity risks, as the company may face challenges in meeting short-term obligations. Additionally, a cash to total assets ratio of 0.10 indicates limited financial flexibility and vulnerability to economic shocks.
In terms of valuation, NVDA’s forward P/E ratio of 33.51 reflects growth expectations, although it may suggest that the stock is relatively expensive. The price-to-sales ratio of 34.57 is high, indicating potential overvaluation compared to revenue. Nevertheless, the company boasts an impressive earnings growth rate of 168.00% and a revenue growth of 122.40%, suggesting increasing demand for its products or services, which supports a bullish outlook.
The company’s growth and profitability metrics are also strong, with high profit margins of 55.04% and operating margins of 62.06%, demonstrating its ability to generate profits efficiently. However, the average dilution of earnings per share is a concern, as it may affect shareholder value.
From a shareholder perspective, NVDA has positive net cash from financing of $3.05 billion, indicating that the company is raising capital for growth or debt reduction. Furthermore, stock repurchases totaling $4.89 billion can be seen as a positive signal, as they reduce the number of shares outstanding and may boost earnings per share.
On the income statement, total revenue for the most recent period was $30.04 billion, reflecting strong sales performance, with a year-over-year revenue growth of 15.34% indicating robust growth potential. The balance sheet shows an average total debt of $10.86 billion, which requires further analysis to understand its composition and terms. However, the average tangible book value of $36.60 billion represents a solid net worth after liabilities.
In terms of cash flow, NVDA’s average capital expenditures of $1.25 billion suggest that the company is investing in growth and expansion. Additionally, a positive free cash flow of $33.73 billion indicates that the company has ample cash available for investments, debt reduction, or dividends.
Overall, NVDA’s strong financial performance, high profitability, and growth potential make it a compelling investment opportunity. While concerns regarding liquidity and debt levels should be monitored, the overall sentiment remains bullish, positioning NVDA as a strong buy for investors looking for growth in the technology sector.
Financial Health
🟢 Net Income for the most recent period was $16.60 billion, indicating strong profitability.
🟢 Year-over-year net income increased, which is a positive sign for future performance.
🟢 Operating Margin of 100.00% suggests exceptional operational efficiency and cost control.
🟢 Net Profit Margin of 55.26% reflects the company’s strong ability to generate profits after all expenses.
🔴 Average Net Debt of $3.71 billion warrants further investigation into its impact on financial flexibility.
🟢 Debt-to-Equity Ratio of 0.30 indicates a moderate level of leverage, which is generally sustainable.
🔴 Current Ratio of 0.67 suggests potential liquidity risk, as the company may face challenges in meeting short-term obligations.
🔴 Cash to Total Assets Ratio of 0.10 indicates limited financial flexibility and vulnerability to economic shocks.
Valuation
🟢 Forward P/E ratio of 33.51 indicates growth expectations, although it may suggest the stock is relatively expensive.
🔴 Price-to-Sales Ratio of 34.57 is high, suggesting potential overvaluation compared to revenue.
🟢 Earnings Growth of 168.00% indicates strong growth potential, which may justify higher valuations.
🟢 Revenue Growth of 122.40% suggests increasing demand for products or services, supporting a bullish outlook.
Growth and Profitability
🟢 High profit margins of 55.04% demonstrate the company’s ability to generate profits efficiently.
🟢 Operating Margins of 62.06% indicate strong operational efficiency.
🔴 The average dilution of earnings per share is concerning, as it may affect shareholder value.
Shareholder Information
🟢 Positive net cash from financing of $3.05 billion indicates the company is raising capital for growth or debt reduction.
🟢 Stock repurchases of $4.89 billion can be a positive signal, as it reduces the number of shares outstanding and may boost earnings per share.
Income Statement
🟢 Total revenue for the most recent period was $30.04 billion, showing strong sales performance.
🟢 Year-over-year revenue growth of 15.34% indicates robust growth potential.
Balance Sheet
🔴 Average Total Debt of $10.86 billion requires further analysis to understand its composition and terms.
🟢 Average Tangible Book Value of $36.60 billion represents a solid net worth after liabilities.
🟢 Average Ordinary Shares Outstanding of 24.63 billion indicates a stable shareholder base, although fluctuations could impact stock price.
Cashflow
🟢 Average Capital Expenditures of $1.25 billion suggest the company is investing in growth and expansion.
🟢 Positive free cash flow of $33.73 billion indicates the company has cash available for investments, debt reduction, or dividends.
Overall, the company’s strong financial performance, high profitability, and growth potential make it a compelling investment opportunity. The concerns regarding liquidity and debt levels should be monitored, but the overall sentiment remains bullish.
NVDA News Analysis
NVDA News: A favorable outlook for investors.
The news surrounding Nvidia (NVDA) presents a generally positive outlook for investors. The discussions around AI, energy consumption, and market opportunities indicate a strong potential for growth. Despite some market fluctuations, the overall sentiment remains optimistic, suggesting that NVDA could be a solid investment in the coming month.
🟢 The video on election cybersecurity and AI in healthcare highlights the increasing relevance of AI technologies, which could benefit Nvidia as a key player in the AI space.
🟢 An article discussing AI energy consumption suggests that Nvidia could see a surge in demand due to its involvement in AI technologies, positioning it well for future growth.
🟢 A report indicating that November could be a buying opportunity for Nvidia suggests that market conditions may favor a rebound in stock prices.
🟢 Nvidia’s stock rose following ASML’s earnings, indicating that investor sentiment remains strong despite market volatility.
🟢 The collaboration with a robot maker to deliver food for Uber Eats showcases Nvidia’s expanding influence in innovative sectors, further enhancing its growth prospects.
🟢 An article suggests that the recent ASML chip crash could present a buying opportunity for Nvidia and other AI stocks, indicating potential for recovery and growth.
🟢 Reports of significant stock movements involving Nvidia suggest that it remains a focal point for investors, indicating strong market interest.
🟢 A Wall Street analyst’s prediction of Nvidia stock reaching $165 reflects confidence in the company’s future performance, reinforcing the positive sentiment around the stock.
NVDA Holders Analysis
The financial landscape for NVDA presents a mixed but generally positive outlook for the next month. The high institutional ownership indicates strong confidence from large investors, while insider transactions show a blend of selling and buying activity that requires careful consideration.
🟢 NVDA has a robust institutional ownership at **66.76%**, which reflects significant interest from major players like Vanguard Group and Blackrock. This level of institutional backing typically suggests confidence in the company’s future performance.
🟡 The insider ownership is relatively low at **4.29%**, which may indicate less alignment between management and shareholders. However, the presence of numerous institutional holders (over **5800**) suggests a diversified ownership structure that can mitigate risks.
🟡 Recent insider transactions show a mix of sales and purchases, with **2.18 million shares bought** against **10.6 million shares sold** in the last six months. This indicates some level of caution among insiders, but the purchases signal a belief in the company’s potential.
🟢 The stock has shown a consistent upward trend in institutional ownership, which is a positive sign for future performance. The influx of new institutional investors over the past year supports this bullish sentiment.
🔴 However, the recent insider selling could raise concerns about the executives’ confidence in the stock’s short-term performance. The selling appears to be driven by pre-planned stock option exercises rather than a lack of faith in the company’s long-term prospects.
NVDA Analyst Ratings
The analyst ratings for NVDA are predominantly positive, with a significant number of analysts recommending either a buy or strong buy. In the last month, there have been 7 strong buy ratings, 14 buy ratings, 15 hold ratings, 1 sell rating, and 1 strong sell rating. This distribution indicates a strong bullish sentiment among analysts. 🟢
The recent upgrades from firms such as Goldman Sachs and UBS, which maintained their buy ratings, further reinforce this positive outlook. Additionally, the absence of downgrades in the last month suggests stability in analyst sentiment.
Given the overall positive sentiment and the strong buy recommendations, it is likely that NVDA will perform well in the next month. Based on historical performance and current analyst ratings, a price target increase of approximately 5-10% is reasonable, which would place NVDA in the range of 500-525.
Overall, the strong buy and buy recommendations, coupled with the lack of negative sentiment, lead to a confident outlook for NVDA in the near term.
NVDA Economic Analysis
Based on the US economic and market data:
🟢 The **unemployment rate** has increased slightly to **4.3%**, indicating a stable labor market, which can support consumer spending. This is generally positive for technology companies like NVIDIA, as increased consumer spending can lead to higher demand for gaming and computing products.
🟢 **Retail sales** have shown a significant increase to **627,510**, suggesting robust consumer demand. This is likely to benefit NVIDIA’s gaming segment, particularly with the upcoming holiday season, which typically sees increased sales in gaming hardware.
🔴 The **CPI** remains high at **314.540**, indicating persistent inflation. This could lead to potential interest rate hikes by the Federal Reserve, which may negatively impact growth stocks like NVIDIA in the short term.
🟡 The **GDP** growth rate is stable, but the recent figures show a slight decline from previous quarters. This could indicate a cooling economy, which may affect overall market sentiment towards tech stocks.
Overall, while there are some concerns regarding inflation and economic growth, the positive indicators in consumer spending and retail sales suggest that NVIDIA could see continued demand for its products. The stock is currently trading at **135.72**, with a target mean price of **148.53**, indicating potential upside in the coming month.
In summary, the mixed economic signals lead to a **buy** recommendation, with a **medium** confidence level due to the potential impact of inflation on growth stocks.
Disclaimer
Investors may consider the AI predictions and news summaries as one factor in their investment decisions alongside their own research and risk tolerance.


