
AME Stock Analysis: A Mixed Outlook Ahead!
🔴 Recommendation: AME is currently presenting a complex financial picture, with both bullish and bearish indicators that warrant careful consideration.
📈 Key Highlights:
Trend Analysis: The stock shows a bullish trend with the price above the 50-day EMA, but is below the 200-day EMA, indicating conflicting signals.
Market Behavior: The price is nearing resistance levels, suggesting a potential selling opportunity in a ranging market.
Financial Health: Average net debt is high at $2.12 trillion, raising concerns about liquidity and debt servicing capabilities.
⚠️ Caution Flags:
Negative Indicators: The current ratio of 0.54 indicates potential liquidity risk, while the price-to-sales ratio of 5.70 suggests possible overvaluation.
Insider Activity: Low insider ownership at 0.45% raises questions about management’s confidence in the stock.
As we delve deeper into the analysis, we will explore the price trends, key indicators, financial health, valuation metrics, and more to provide a comprehensive view of AME’s potential moving forward. Stay tuned! 👇
AME Price Analysis
| Positive Momentum Signals | Negative Momentum Signals | Hold Momentum Signals |
|---|---|---|
|
|
|
| Positive Trend Signals | Negative Trend Signals | Hold Trend Signals |
|---|---|---|
|
|
|
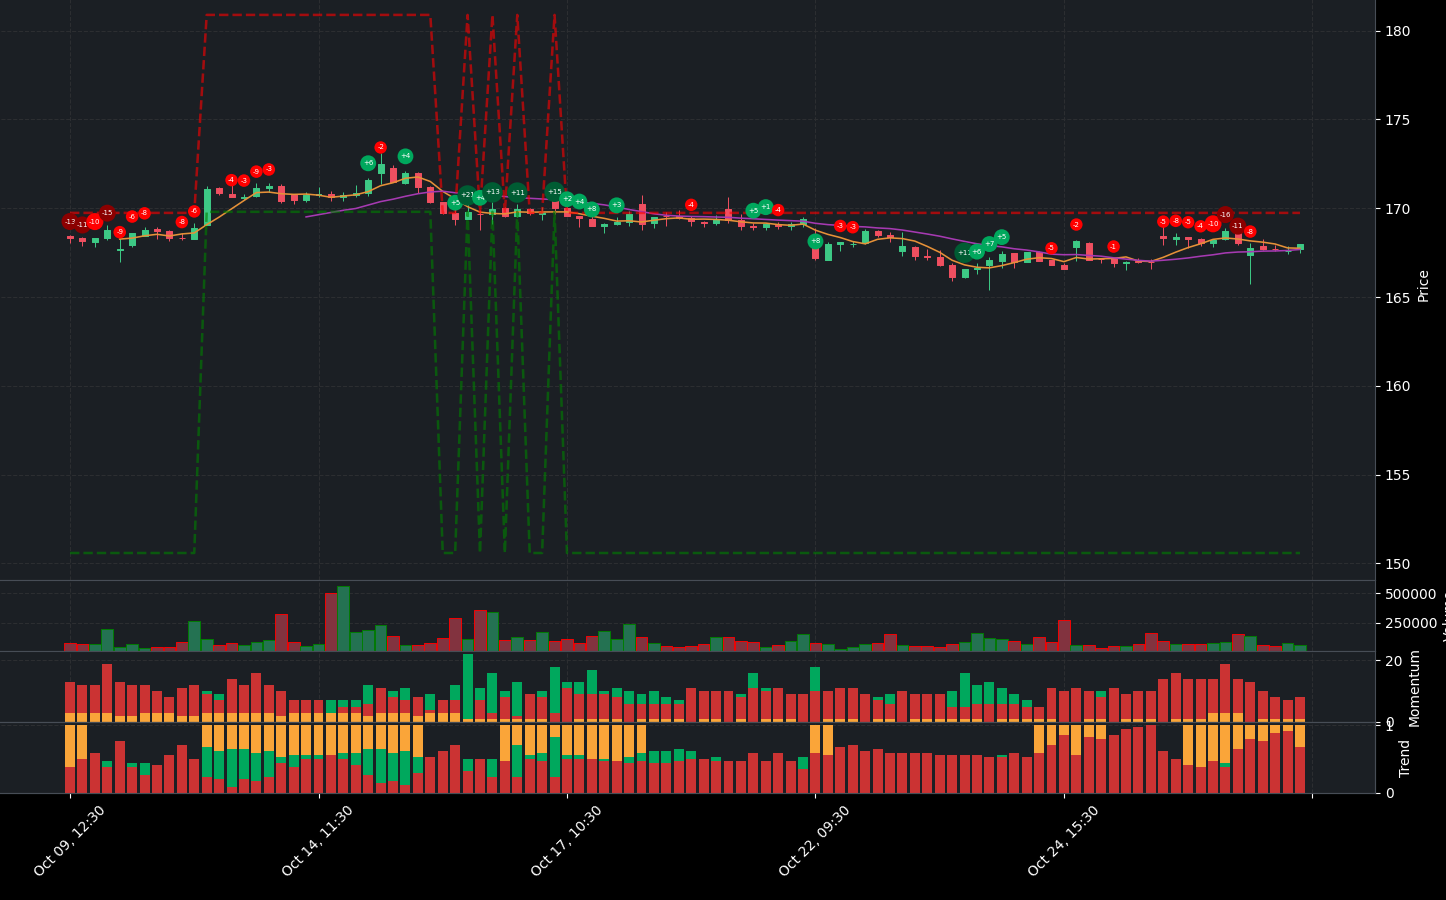
AME stock presents a complex financial picture, characterized by both positive and negative indicators. On the positive side, the stock shows a bullish trend with the price currently above the 50-day EMA and the Supertrend indicator also signaling bullish momentum. Additionally, the On-Balance Volume (OBV) is increasing, suggesting that buying pressure is present. The StochRSI indicates a bullish crossover, and the WaveTrend oscillator is in an oversold condition, hinting at a potential bottom.
However, caution is warranted due to several negative indicators. The stock is currently below the 200-day EMA, indicating a bearish trend, and the EMA 200 is showing signs of strengthening bearish momentum. Furthermore, the price is approaching resistance levels, which could lead to a potential reversal. The WaveTrend also indicates a bearish divergence, suggesting that the upward price movement may not be sustainable.
In terms of market behavior, the price rebound towards the middle band of its trading range could present a selling opportunity in a ranging market. Investors are advised to consider entering short positions and setting stop-loss orders to mitigate potential losses.
Overall, while AME stock has some bullish indicators, the presence of significant bearish signals and its position near resistance levels suggest that investors should proceed with caution. A sell recommendation is appropriate at this time, with a focus on monitoring market conditions for any signs of a reversal or further deterioration in momentum.
AME Fundamental Analysis
AME’s financial health presents a mixed picture, warranting careful consideration from potential investors. On one hand, the company shows signs of profitability with a positive net income of $337.68 million and an impressive operating margin of 100.00%, indicating efficient operations and strong cost control. Additionally, the net profit margin of 19.46% reflects the company’s ability to generate profits after accounting for all expenses.
However, several concerning factors emerge upon closer examination. The average net debt stands at a high $2.12 trillion, raising questions about the company’s financial flexibility and its capacity to service debt obligations. The current ratio of 0.54 suggests potential liquidity risks, indicating challenges in meeting short-term financial commitments. Furthermore, the average tangible book value of -1.14 trillion points to a negative net worth, which is alarming for investors.
Valuation metrics also raise red flags. The forward P/E ratio of 23.07 suggests the stock may be fairly valued relative to its earnings growth, but the price-to-sales ratio of 5.70 indicates potential overvaluation compared to industry averages. This discrepancy could deter value-focused investors.
Growth prospects appear to be under pressure, as evidenced by a year-over-year revenue decline of 0.08%. This slight decrease could negatively impact future performance, despite the positive net income trend. Additionally, the negative net interest income of -30.59 million and the corresponding interest expense raise concerns about the company’s ability to manage its debt effectively.
On a more positive note, the company is actively investing in growth, as indicated by average capital expenditures of $115.03 million. The positive net cash from financing of $73.99 million suggests that AME is raising capital, potentially for growth initiatives or debt reduction. Moreover, the stock repurchase activity of $89.99 million may signal management’s confidence in the company’s future prospects.
In summary, AME’s financial landscape is characterized by both strengths and weaknesses. While the company demonstrates profitability and efficient operations, significant concerns regarding debt levels, liquidity, and revenue growth persist. As a result, the overall recommendation is neutral. Investors should conduct thorough due diligence and consider the company’s ability to navigate its financial challenges before making any investment decisions.
Financial Health
🔴 Average Net Debt is high at $2.12 trillion, warranting further investigation into its impact on financial flexibility and ability to service debt obligations.
🔴 Current Ratio of 0.54 suggests potential liquidity risk, indicating challenges in meeting short-term financial obligations.
🟢 Debt-to-Equity Ratio of -2.33 suggests a moderate level of leverage, which may be sustainable depending on the company’s industry and profitability.
🟡 Cash to Total Assets Ratio of 0.04 indicates limited financial flexibility and a higher vulnerability to economic shocks.
Valuation
🟡 Forward P/E ratio of 23.07 suggests the stock may be fairly valued relative to its earnings growth.
🔴 Price-to-Sales Ratio of 5.70 indicates potential overvaluation, as it is relatively high compared to industry averages.
Growth and Profitability
🟢 Net Income for the most recent period was positive at $337.68 million, showing profitability.
🔴 Year-over-year revenue growth was -0.08%, indicating a slight decline in revenue, which could negatively impact future performance.
🟢 Operating Margin of 100.00% suggests efficient operations and good cost control.
🟢 Net Profit Margin of 19.46% reflects the company’s ability to generate profits after all expenses.
Shareholder Information
🟡 Average Ordinary Shares Outstanding at 231,037,666 indicates a stable shareholder base.
🟢 Average Treasury Shares of 38,354,154 could indicate share buyback activity, potentially signaling management’s confidence in the company’s future prospects.
Income Statement
🟢 Net Income trend shows year-over-year increase, which is generally a positive sign.
🔴 Net Interest Income of -30.59 million indicates the company is paying more in interest on its debts than it is earning on its assets.
🔴 Interest Expense of 30.59 million raises concerns about the company’s debt servicing capabilities.
Balance Sheet
🔴 Average Tangible Book Value of -1.14 trillion indicates negative net worth after deducting liabilities from assets, which is concerning.
🔴 Average Total Debt of $2.66 trillion requires further analysis to understand its composition and terms.
Cashflow
🟢 Average Capital Expenditures of $115.03 million suggests the company is investing in growth and expansion.
🟢 Positive Net Cash from Financing of $73.99 million indicates the company is raising capital, which could be used for growth or debt reduction.
🟢 Stock Repurchases of $89.99 million can be a positive signal as it reduces the number of shares outstanding and may boost earnings per share (EPS).
Overall, the analysis presents a mixed picture with both positive and negative indicators, leading to a neutral recommendation.
AME News Analysis
AMETEK (AME) presents a mixed outlook for investors. While there are positive returns over the past five years and price target adjustments from analysts, concerns about a potential decline in earnings could weigh on the stock. Investors should weigh these factors carefully.
🟢 AMETEK (NYSE:AME) has delivered a favorable 83% return over the last five years, indicating strong long-term performance and investor satisfaction.
🟢 Analysts have adjusted price targets upward, with Mizuho Securities raising it to $190 from $180 and Truist Securities to $219 from $201, reflecting confidence in AME’s growth potential.
🔴 However, there are concerns as analysts estimate a decline in earnings for the upcoming quarter, which could negatively impact investor sentiment.
🔴 TD Cowen has downgraded AMETEK to Sell from Hold, setting a price target of $158, indicating a bearish outlook from some analysts.
🟢 The announcement of the third quarter 2024 earnings call suggests that the company is maintaining transparency with investors, which is generally a positive sign.
🔴 A comparison with ITRI raises questions about AME’s value proposition, suggesting that investors may need to consider alternatives.
AME Holders Analysis
The financial landscape for AME indicates a generally positive outlook, but caution is warranted due to mixed signals from insider activities and the low insider ownership.
🟢 AME has a **high institutional ownership** at **90.03%**, which reflects strong interest from large investors. This level of institutional backing typically suggests confidence in the company’s future performance.
🟡 The **low insider ownership** of **0.45%** raises concerns about management’s confidence in the company. This could indicate a lack of alignment between management and shareholder interests, which is something to monitor.
🟡 The **number of institutional holders** is substantial at **1268**, indicating a diversified ownership structure. This can help stabilize the stock price, but it also means that any significant selling by these institutions could lead to increased volatility.
🟢 Recent **insider transactions** show a mix of sales, but there have been no significant insider purchases in the last six months. This could suggest that insiders are not currently bullish on the stock, which is a point of concern.
🔴 The **absence of insider purchases** may indicate a lack of confidence from those who know the company best. This is a critical factor to consider when evaluating the stock’s potential.
AME Analyst Ratings
The analyst ratings for AME show a generally positive outlook, with a notable number of analysts recommending a buy or strong buy. In the most recent month, there were 6 strong buy ratings, 7 buy ratings, and only 1 hold rating, indicating a bullish sentiment among analysts. However, the downgrade from TD Cowen from hold to sell raises some caution.
🟢 Over the past month, the distribution of ratings suggests a strong inclination towards buying, with no sell or strong sell ratings reported. This reflects a positive sentiment towards AME’s performance.
🟡 Given the mixed signals from recent upgrades and downgrades, it is reasonable to expect that AME may see moderate growth in the next month, potentially in the range of 3-5%. However, the medium confidence level indicates that investors should remain vigilant for any changes in market conditions or further analyst actions.
AME Economic Analysis
Based on the US economic and market data:
🟢 The recent Non-Farm Payroll data shows an increase to 158,445 jobs, indicating a strengthening labor market which typically supports consumer spending and corporate earnings.
🟢 The unemployment rate has slightly increased to 4.3%, but it remains relatively low, suggesting that the labor market is still healthy. This can lead to increased demand for AMETEK’s products across various sectors.
🟡 Retail sales have shown a positive trend, with a notable figure of 627,510.0, indicating consumer confidence and spending, which is beneficial for AMETEK’s sales in the industrial machinery sector.
🔴 The CPI remains high at 314.540, indicating persistent inflation, which could lead to increased costs for AMETEK and pressure on profit margins if not managed effectively.
🟢 The overall GDP growth is stable, with a figure of 5737.189, suggesting a resilient economy that can support industrial growth.
In the next month, I expect AMETEK’s stock price to remain stable with potential upward movement, targeting a price range between 170 and 180. The current price of 167.97 suggests a reasonable entry point, especially considering the company’s strong fundamentals and market position. However, the inflationary pressures should be monitored closely as they could impact future earnings.
Disclaimer
Investors may consider the AI predictions and news summaries as one factor in their investment decisions alongside their own research and risk tolerance.


