
AMZN Stock Analysis: A Mixed Outlook Ahead!
🔴 Recommendation: Amazon (AMZN) presents a complex financial picture with both bullish and bearish indicators, suggesting a cautious approach for investors.
📈 Key Highlights:
Trend Analysis: Currently experiencing a bullish trend with the price above the 200-day EMA and the Supertrend indicator, indicating potential for a price rebound despite being below the 50-day EMA.
Financial Health: Positive net income of $13.49 billion and a healthy current ratio of 1.52, but concerns arise from a low net profit margin of 9.11% and significant debt levels.
Growth Potential: Strong earnings growth of 93.80% and moderate revenue growth of 3.25% year-over-year, indicating potential for future profitability.
⚠️ Caution Flags:
Valuation Concerns: Forward P/E ratio of 32.28 and price-to-sales ratio of 3.28 suggest potential overvaluation.
Market Sentiment: Recent stock dips amidst broader market gains indicate short-term challenges, despite ongoing innovations in AI technology.
Let’s dive into the details as we break down the price trends, indicators, financial health, valuation metrics, and more 👇
AMZN Price Analysis
| Positive Momentum Signals | Negative Momentum Signals | Hold Momentum Signals |
|---|---|---|
|
|
| Positive Trend Signals | Negative Trend Signals | Hold Trend Signals |
|---|---|---|
|
|
|
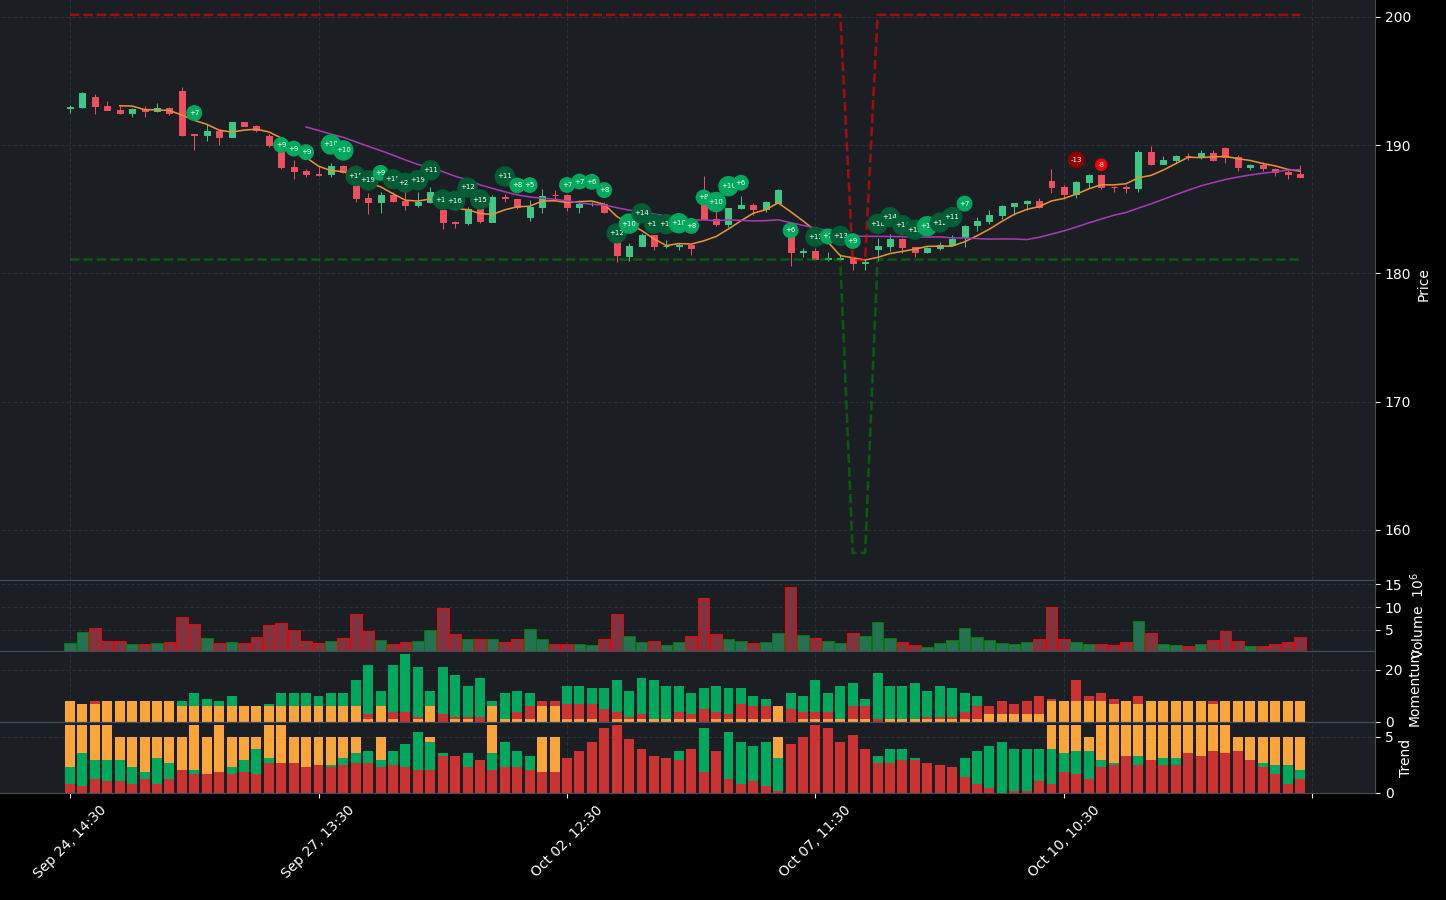
Amazon (AMZN) presents a complex financial picture, characterized by both positive and negative indicators. On the positive side, the stock is currently experiencing a bullish trend, as evidenced by its price being above the 200-day EMA and the Supertrend indicator, which also shows that the price is above the Supertrend line. Additionally, the StochRSI indicates that the stock is oversold, suggesting potential for a price rebound.
However, caution is warranted due to several negative indicators. The stock is currently below the 50-day EMA, indicating a bearish trend that is strengthening. The On-Balance Volume (OBV) is decreasing, which, coupled with high volume decreasing, suggests waning buying interest. Furthermore, while the price is above the lower band, it is below the middle band of the Bollinger Bands, indicating a downtrend that investors should be wary of, especially in light of the oversold conditions.
In summary, while AMZN shows signs of a potential recovery due to its bullish long-term trend and oversold status, the bearish short-term indicators and decreasing volume raise concerns about its immediate performance. Investors may want to adopt a cautious approach, considering a hold strategy until clearer signals of a sustained upward movement emerge.
AMZN Fundamental Analysis
AMZN’s recent financial performance presents a mixed picture, prompting a neutral outlook for investors. On the positive side, the company reported a net income of $13.49 billion for the most recent period, indicating profitability and a year-over-year increase in net income, which is generally a favorable sign for financial health. Additionally, a current ratio of 1.52 suggests a healthy liquidity position, allowing the company to comfortably cover its short-term liabilities.
However, there are notable concerns regarding profitability. The net profit margin of 9.11% is relatively low, raising questions about the company’s overall profitability. Furthermore, the forward P/E ratio of 32.28 and a price-to-sales ratio of 3.28 indicate potential overvaluation, as both metrics exceed typical thresholds. This could suggest that the stock is priced higher than its earnings and sales justify.
In terms of growth, AMZN has shown revenue growth of 3.25% year-over-year, which, while positive, is considered moderate and may not indicate aggressive expansion. The operating margin of 9.92% is also low, hinting at potential inefficiencies in operations. On a brighter note, the company has achieved an impressive earnings growth of 93.80%, reflecting significant improvements in profitability over time.
Shareholder considerations reveal mixed signals as well. The average ordinary shares outstanding at 10.38 billion raises potential dilution concerns for existing shareholders, although the company has engaged in stock repurchases of $1.5 billion, which can positively impact earnings per share (EPS) by reducing the number of shares outstanding.
From a balance sheet perspective, the average total debt of $135.83 billion necessitates further analysis to understand its implications on financial health. The average tangible book value of $176.98 billion indicates a solid equity base, but a cash to total assets ratio of 0.12 is relatively low, suggesting limited financial flexibility and increased vulnerability to economic shocks.
On the cash flow front, AMZN demonstrates strength with an average free cash flow of $59.19 billion, indicating ample cash for operations and growth initiatives. The average capital expenditures of $54.39 billion suggest ongoing investments in growth and expansion, while positive net cash from financing activities indicates the company is raising capital for potential growth or debt reduction.
In summary, while AMZN shows positive indicators such as revenue growth and net income, concerns regarding profitability margins, valuation metrics, and debt levels suggest a cautious approach. Investors should weigh these factors carefully before making any investment decisions.
Financial Health
🟢 Net Income for the most recent period was positive at $13.49 billion, indicating profitability.
🟢 Year-over-year net income increased, which is generally a positive sign for the company’s financial health.
🔴 Net Profit Margin of 9.11% is relatively low, which could be a concern for investors regarding profitability.
🟢 Current Ratio of 1.52 indicates a healthy liquidity position, suggesting the company can cover its short-term liabilities comfortably.
🔴 Average Net Debt of $14.27 billion warrants further investigation into its impact on financial flexibility and ability to service debt obligations.
🔴 Debt-to-Equity Ratio of 0.77 suggests a moderate level of leverage, which may be sustainable but still poses some risk.
Valuation
🔴 Forward P/E ratio of 32.28 indicates potential future overvaluation, as it is above the typical threshold of 25.
🔴 Price-to-Sales Ratio of 3.28 suggests potential overvaluation, as it is above the common benchmark of 2.
Growth and Profitability
🟢 Revenue Growth of 3.25% year-over-year suggests moderate growth, which could still be positive for the stock price.
🔴 Operating Margin of 9.92% is low, indicating potential inefficiencies in the company’s operations.
🟢 Earnings Growth of 93.80% is strong, reflecting a significant improvement in profitability over time.
Shareholder Information
🔴 Average Ordinary Shares Outstanding at 10.38 billion indicates potential dilution concerns for existing shareholders.
🟢 Stock Repurchases of $1.5 billion can be a positive signal as it reduces the number of shares outstanding and may boost earnings per share (EPS).
Income Statement
🟢 Total Revenue for the most recent period was $147.98 billion, showing strong sales performance.
🔴 Year-over-year revenue growth of 3.25% is moderate, indicating that while the company is growing, it may not be at an aggressive pace.
🔴 Operating Margin of 100.00% is an anomaly and should be interpreted with caution; it suggests efficient operations but may not reflect typical operational performance.
Balance Sheet
🔴 Average Total Debt of $135.83 billion requires further analysis to understand its composition and terms, which could impact financial health.
🟢 Average Tangible Book Value of $176.98 billion represents the net worth of the company after deducting liabilities from assets, indicating a solid equity base.
🔴 Cash to Total Assets Ratio of 0.12 is relatively low, indicating limited financial flexibility and a higher vulnerability to economic shocks.
Cashflow
🟢 Average Free Cash Flow of $59.19 billion is strong, indicating the company has sufficient cash to fund operations and growth initiatives.
🟢 Average Capital Expenditures of $54.39 billion suggests the company is investing in growth and expansion.
🟢 Positive net cash from financing activities indicates the company is raising capital, which could be used for growth or debt reduction.
Overall, while there are positive indicators such as revenue growth and net income, concerns about profitability margins, valuation metrics, and debt levels suggest a cautious approach.
AMZN News Analysis
AMZN News: A mixed outlook for investors.
Summary of AMZN news indicates a blend of positive and negative developments. While Amazon is making strides in AI technology and is recognized as a top growth stock, it has also experienced a stock dip amidst market gains. Investors should weigh these factors carefully.
🟢 Amazon is deploying AI-powered technology to assist delivery drivers in locating packages, which could enhance operational efficiency and customer satisfaction.
🟢 The company is highlighted as a top growth stock for the long term, suggesting strong fundamentals and growth potential.
🔴 However, Amazon’s stock has dipped while the broader market has gained, indicating potential short-term challenges.
🟢 The overall sentiment around Amazon remains positive, with ongoing innovations and a strong market position.
🔴 The mixed signals from recent news suggest that while there are growth opportunities, investors should be cautious of short-term volatility.
AMZN Holders Analysis
The financial health of AMZN indicates a generally positive outlook, but there are some cautionary signs that investors should consider.
🟢 AMZN has a **high institutional ownership** at 64.14%, which reflects strong confidence from large investors. This level of institutional backing typically suggests a solid foundation for the stock’s performance.
🟡 The **insider ownership** at 8.99% is moderate, indicating some alignment of interests between management and shareholders, but it could be higher to instill greater confidence.
🟢 The number of institutional holders is substantial at **6304**, suggesting widespread interest and diversification among investors, which can help stabilize the stock price.
🟡 Recent **insider transactions** show a mix of sales and purchases, with more sales than purchases in the last six months. This could indicate some caution from insiders regarding the stock’s near-term performance.
🔴 The **insider purchases** are relatively low compared to sales, with a significant number of shares sold in the past months, which may raise concerns about the company’s immediate outlook.
🟢 Despite these mixed signals, AMZN’s strong market position and ongoing growth initiatives in e-commerce and cloud services provide a solid foundation for future performance.
AMZN Analyst Ratings
The analyst ratings for AMZN are overwhelmingly positive, with a significant number of analysts recommending either a buy or strong buy. In the last month, there have been 15 strong buy ratings, 28 buy ratings, 3 hold ratings, 1 sell rating, and no strong sell ratings. This indicates a very bullish sentiment among analysts. 🟢
The recent upgrades from firms such as Evercore ISI Group and Scotiabank further reinforce this positive outlook. The consistent trend of upgrades over the past three months, with no downgrades, suggests strong confidence in AMZN’s performance.
Given the current analyst sentiment and the absence of negative ratings, it is likely that AMZN will see a positive price movement in the next month. The stock could potentially rise by 5-10% based on historical performance and current market conditions.
Overall, the strong buy recommendation reflects a robust outlook for AMZN, supported by high analyst confidence and positive market sentiment.
AMZN Economic Analysis
Based on the US economic and market data:
🟢 The **unemployment rate** has increased slightly to **4.3%**, but it remains relatively low, indicating a stable labor market that supports consumer spending. This is crucial for Amazon as it relies heavily on consumer demand for its retail operations.
🟢 **Retail sales** have shown a positive trend, with a figure of **627,510** in the latest report, suggesting that consumers are still willing to spend. This is a good sign for Amazon’s revenue growth, especially in the holiday season approaching.
🔴 The **monthly treasury yield** has increased to **4.25%**, which could lead to higher borrowing costs for companies, including Amazon. This may affect their expansion plans or operational costs, but Amazon’s strong cash flow can mitigate this risk.
🟡 The **GDP** growth rate is stable, but the recent figures show a slight decline from previous quarters. This could indicate a cooling economy, which may affect consumer spending in the long run.
🟢 Amazon’s **earnings growth** has been impressive at **93.8%**, and with a **profit margin** of **7.35%**, the company is well-positioned to capitalize on any uptick in consumer spending.
Overall, while there are some concerns regarding rising yields and a slight increase in unemployment, the positive retail sales figures and Amazon’s strong fundamentals support a **buy** recommendation. The stock is currently trading at **187.54**, with a target mean price of **218.9**, indicating a potential upside of approximately **16.7%** over the next month.
Disclaimer
Investors may consider the AI predictions and news summaries as one factor in their investment decisions alongside their own research and risk tolerance.


