AMZN Stock Analysis: A Cautious Buy Signal Amid Mixed Indicators
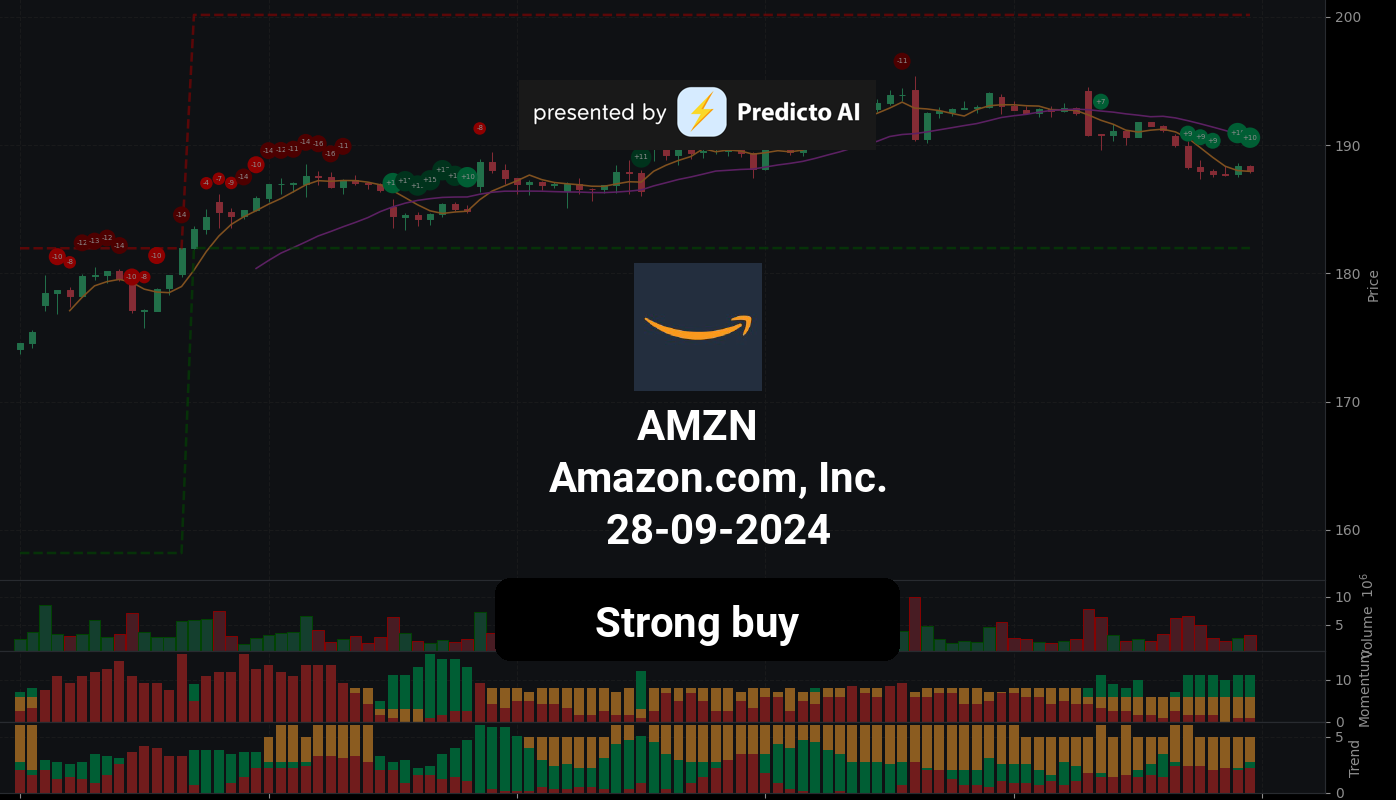
🔵 Recommendation: Amazon (AMZN) is currently rated a strong buy, reflecting significant upside potential for investors willing to navigate the complexities of the market.
📈 Key Highlights:
Momentum Indicators: Positive signs of recovery with StochRSI and WaveTrend in oversold territory, suggesting a potential rebound.
Financial Health: Strong net income of $13.49 billion and impressive earnings growth of 93.80%, although profit margins remain a concern.
Institutional Ownership: High institutional ownership at 64.16% indicates strong interest from large investors, supporting stock stability.
⚠️ Caution Flags:
Bearish Trends: The price is below the 50-day EMA and Supertrend line, indicating a strengthening bearish trend.
Valuation Concerns: Forward P/E ratio of 32.30 suggests potential overvaluation, which may deter value-focused investors.
Employee Sentiment: Backlash against Amazon’s return-to-office policy could impact operational efficiency and employee morale.
Let’s dive into the details as we break down the price trends, indicators, financial health, valuation metrics, and more 👇
AMZN Price Analysis
| Positive Momentum Signals | Negative Momentum Signals | Hold Momentum Signals |
|---|---|---|
|
|
| Positive Trend Signals | Negative Trend Signals | Hold Trend Signals |
|---|---|---|
|
|
|
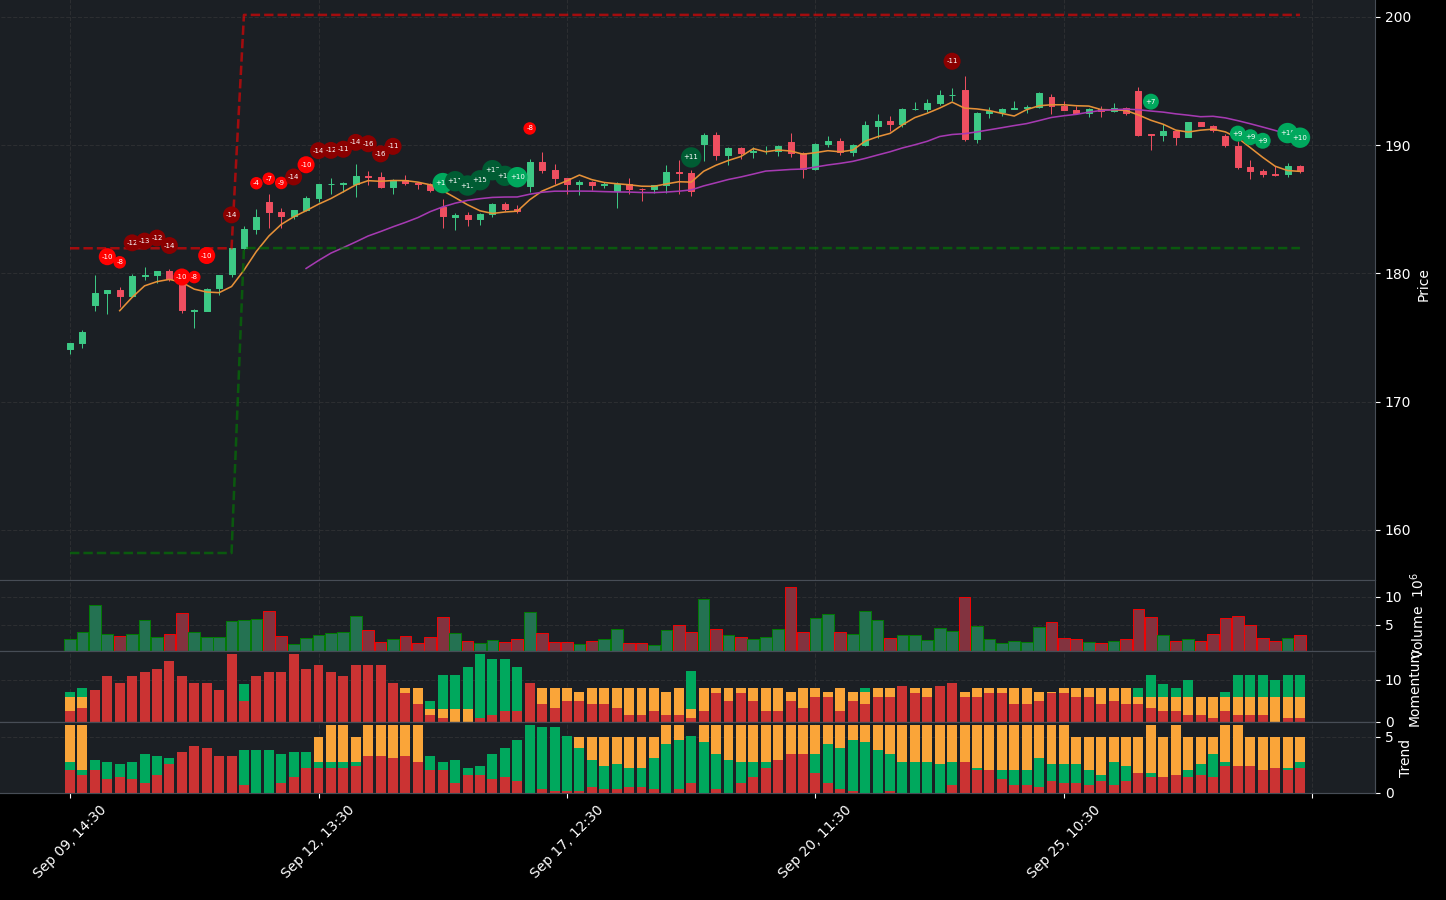
Amazon (AMZN) presents a complex investment landscape characterized by both positive and negative indicators. Currently, the stock is rated a strong buy, suggesting that there may be significant upside potential for investors willing to take on some risk.
On the positive side, momentum indicators are showing signs of recovery. The StochRSI and WaveTrend indicators are both in oversold territory, indicating a potential bottom and suggesting that the stock may be poised for a rebound. Additionally, trend indicators are also favorable; the price is currently above the 200-day EMA, which is a bullish sign, and the MACD has shown a positive histogram crossover, further reinforcing the bullish trend.
However, caution is warranted due to several negative indicators. The price is below the 50-day EMA, indicating a bearish trend that is strengthening. The Supertrend indicator also reflects a bearish sentiment, as the price is below the Supertrend line. Furthermore, the On-Balance Volume (OBV) is decreasing, which could suggest weakening buying pressure. The price is currently below the Middle Band but above the Lower Band, indicating a downtrend, albeit one that may be influenced by oversold conditions.
In summary, while Amazon’s stock shows promising signs of recovery with strong buy signals and positive momentum indicators, the presence of bearish trends and decreasing volume suggests that investors should proceed with caution. A balanced approach may be advisable, considering both the potential for upside and the risks associated with current bearish trends. Investors might consider a buy position, but should remain vigilant for any signs of further deterioration in momentum or trend indicators.
AMZN Fundamental Analysis
Amazon’s recent financial performance presents a mixed picture, prompting a cautious outlook for investors. On the positive side, the company reported a net income of $13.49 billion for the most recent period, indicating profitability. Furthermore, the year-over-year increase in net income is a favorable sign for its financial health. The operating margin of 100.00% reflects efficient operations and effective cost control, which are commendable attributes.
However, there are notable concerns that investors should consider. The net profit margin of 9.11% is relatively low, raising questions about the company’s overall profitability. Additionally, the average net debt of $14.01 billion and a debt-to-equity ratio of 0.77 suggest a moderate level of leverage, which, while potentially manageable, introduces some risk to financial stability.
In terms of valuation, the forward P/E ratio of 32.30 and a price-to-sales ratio of 3.26 indicate potential overvaluation, which could deter value-focused investors. On a brighter note, the earnings growth of 93.80% is impressive and suggests strong potential for future profitability.
When examining growth and profitability metrics, Amazon’s revenue growth of 3.25% year-over-year indicates moderate growth, which is positive but not aggressive. However, the low profit margins of 7.35% highlight challenges in cost control and profit generation.
Shareholder information reveals that the average ordinary shares outstanding at 10.38 billion could lead to potential dilution of earnings per share. On a positive note, the company has engaged in stock repurchases totaling $1.5 billion, which can enhance earnings per share by reducing the number of shares outstanding.
From an income statement perspective, total revenue of $147.98 billion demonstrates strong sales performance, although the year-over-year revenue growth of 3.25% suggests a more tempered growth trajectory.
On the balance sheet, a current ratio of 1.52 indicates a healthy liquidity position, suggesting that the company can comfortably cover its short-term liabilities. However, the cash to total assets ratio of 0.12 is relatively low, indicating limited financial flexibility and increased vulnerability to economic shocks. The average total debt of $135.83 billion warrants further analysis to understand its implications on financial health.
In terms of cash flow, the average capital expenditures of $54.39 billion indicate that the company is investing in growth and expansion. Additionally, a positive net cash from financing of $61.14 billion suggests that Amazon is raising capital, which could be directed towards growth initiatives or debt reduction. However, the absence of explicit information regarding average free cash flow raises concerns about cash management.
In summary, while Amazon showcases strong revenue and net income figures, the concerns surrounding profitability margins, potential overvaluation, and debt levels suggest a cautious approach. The company’s growth prospects remain positive, but investors should closely monitor its financial health and operational efficiency before making investment decisions.
Financial Health
🟢 Net Income for the most recent period was positive at $13.49 billion, indicating profitability.
🟢 Year-over-year net income increased, which is generally a positive sign for the company’s financial health.
🔴 Net Profit Margin of 9.11% is relatively low, which could be a concern for investors regarding profitability.
🟢 Operating Margin of 100.00% suggests efficient operations and good cost control.
🔴 Average Net Debt of $14.01 billion warrants further investigation into its impact on financial flexibility and ability to service debt obligations.
🔴 Debt-to-Equity Ratio of 0.77 suggests a moderate level of leverage, which may be sustainable but still poses some risk.
Valuation
🔴 Forward P/E ratio of 32.30 indicates potential future overvaluation, which could deter value-focused investors.
🔴 Price-to-Sales Ratio of 3.26 suggests potential overvaluation, as it is above the typical threshold of 2.
🟢 Earnings Growth of 93.80% is impressive, indicating strong potential for future profitability.
Growth and Profitability
🟢 Revenue Growth of 3.25% year-over-year suggests moderate growth, which could still be positive for the stock price.
🔴 Operating Cash Flow is not explicitly mentioned, but the low net profit margin raises concerns about operational efficiency.
🔴 Profit Margins are low at 7.35%, indicating challenges in controlling costs and generating profits.
Shareholder Information
🔴 Average Ordinary Shares Outstanding at 10.38 billion indicates potential dilution of earnings per share.
🟢 Stock Repurchases of $1.5 billion can be a positive signal as it reduces the number of shares outstanding and may boost earnings per share.
Income Statement
🟢 Total Revenue for the most recent period was $147.98 billion, showing strong sales performance.
🔴 Year-over-year revenue growth of 3.25% is moderate, suggesting that while the company is growing, it may not be at an aggressive pace.
Balance Sheet
🟢 Current Ratio of 1.52 indicates a healthy liquidity position, suggesting the company should be able to cover its short-term liabilities comfortably.
🔴 Cash to Total Assets Ratio of 0.12 is relatively low, which might indicate limited financial flexibility and a higher vulnerability to economic shocks.
🔴 Average Total Debt of $135.83 billion requires further analysis to understand its composition and terms to assess its impact on the company’s financial health.
Cashflow
🟢 Average Capital Expenditures of $54.39 billion suggests the company is investing in growth and expansion.
🟢 Positive Net Cash from Financing of $61.14 billion indicates the company is raising capital, which could be used for growth or debt reduction.
🔴 Average Free Cash Flow is not explicitly mentioned, but the overall financial metrics suggest caution regarding cash management.
Overall, while Amazon shows strong revenue and net income figures, concerns about profitability margins, potential overvaluation, and debt levels suggest a cautious approach. The company’s growth prospects remain positive, but investors should monitor its financial health closely.
AMZN News Analysis
AMZN News: A mixed outlook for investors.
Summary of AMZN news indicates a blend of positive and negative developments. The potential for Amazon to be a top-performing stock in the Dow is encouraging, but the backlash against its return-to-office policy raises concerns about employee sentiment and operational efficiency. Investors should weigh these factors carefully.
🟢 Amazon.com, Inc. (AMZN) is being discussed as a potential best-performing stock in the Dow for 2024, suggesting strong market confidence in its future performance.
🔴 However, there is notable backlash regarding Amazon’s return-to-office (RTO) policy, which could impact employee morale and productivity.
🟢 Cathie Wood’s investment in AMZN indicates institutional confidence, which may positively influence market perception.
🔴 The ongoing antitrust probe involving competitors like Walmart’s Flipkart could create regulatory challenges for Amazon, potentially affecting its market position.
🟢 Analysts are optimistic about Amazon’s long-term growth prospects, with discussions around its stock performance over the next three years being generally positive.
AMZN Holders Analysis
The financial health of AMZN shows a mix of positive and negative indicators, leading to a cautious buy recommendation for the next month.
🟢 AMZN has a **high institutional ownership** at **64.16%**, indicating strong interest from large investors, which typically supports stock stability and growth. Major holders like Vanguard and Blackrock have substantial stakes, reflecting confidence in the company’s future.
🟡 The **insider ownership** stands at **8.99%**, which is moderate. While this suggests some alignment of interests between management and shareholders, a higher percentage could indicate stronger confidence from insiders.
🟡 Recent **insider transactions** show a mix of sales and purchases, with a notable number of shares sold. This could indicate some level of profit-taking or personal financial planning by executives, but it does not necessarily reflect a lack of confidence in the company’s future.
🟢 The **number of institutional holders** is quite high at **6361**, suggesting a diversified ownership base which can help mitigate volatility.
🔴 There has been some **decline in institutional ownership** in recent quarters, which could raise concerns about potential selling pressure if large investors decide to exit.
🔴 The **insider purchases** over the last six months are relatively low compared to sales, indicating that insiders may not be as bullish as one would hope.
AMZN Analyst Ratings
The analyst ratings for AMZN are overwhelmingly positive, with a significant number of analysts recommending either a buy or strong buy. In the last month, there have been 15 strong buy ratings, 28 buy ratings, 3 hold ratings, 1 sell rating, and no strong sell ratings. This indicates a very bullish sentiment among analysts. 🟢
The recent upgrades from firms such as Cantor Fitzgerald and BMO Capital, which maintain an outperform rating, further bolster this positive outlook. The consistent trend of upgrades over the past few months suggests that analysts are confident in AMZN’s growth potential.
Given the strong analyst support and the positive sentiment surrounding AMZN, it is likely that the stock will perform well in the next month. The high confidence level indicates a strong belief in this forecast. Based on current trends, we could see AMZN’s stock price potentially reaching the upper range of its recent performance, possibly around $150 to $160, depending on market conditions.
Overall, the combination of strong buy ratings and positive analyst actions suggests that investors should consider taking a position in AMZN.
AMZN Economic Analysis
Based on the US economic and market data:
🔴 The unemployment rate has increased to 4.3%, up from 4.1% in the previous month, indicating a potential slowdown in the labor market. This could lead to reduced consumer spending, which is critical for Amazon’s retail segment.
🟡 Retail sales have shown a slight increase to 627,510, but this is a modest growth compared to previous months. This suggests that while there is some consumer demand, it may not be robust enough to significantly boost Amazon’s revenues in the short term.
🟢 The GDP growth remains stable at 5737.189, indicating that the overall economy is still growing. A stable GDP can support Amazon’s diverse business segments, including AWS and retail.
🔴 The Monthly Treasury Yield has increased to 4.25%, which could lead to higher borrowing costs for consumers and businesses alike. This may negatively impact Amazon’s growth prospects as higher interest rates can dampen consumer spending.
🟡 The CPI remains relatively stable, but inflationary pressures could still affect consumer purchasing power, which is crucial for Amazon’s sales.
Overall, while there are some positive indicators, the increase in unemployment and rising treasury yields present challenges for Amazon’s stock performance in the coming month. The stock may remain volatile as investors assess these mixed signals.
Disclaimer
Investors may consider the AI predictions and news summaries as one factor in their investment decisions alongside their own research and risk tolerance.

