
BSX Stock Analysis: A Mixed Outlook Ahead!
🔴 Recommendation: BSX is currently rated a strong sell, reflecting significant concerns about its future performance despite some positive indicators.
📈 Key Highlights:
Financial Health: Recent net income stands at $324 million, but a year-over-year decline raises red flags about future profitability.
Debt Levels: With an average net debt of $8.15 billion and a low current ratio of 0.67, liquidity risks are a pressing concern.
Growth Potential: Year-over-year revenue growth of 6.85% indicates moderate growth, although the net profit margin remains low at 7.86%.
⚠️ Caution Flags:
Overvaluation: The forward P/E ratio of 30.97 suggests potential overvaluation, while the price-to-sales ratio of 8.17 raises further concerns.
Insider Ownership: Very low insider ownership at 0.18% could indicate a lack of confidence from management.
As we delve deeper into the analysis, we will explore the price trends, momentum indicators, financial health, valuation metrics, and more to provide a comprehensive view of Boston Scientific’s stock performance. Stay tuned for the detailed breakdown below! 👇
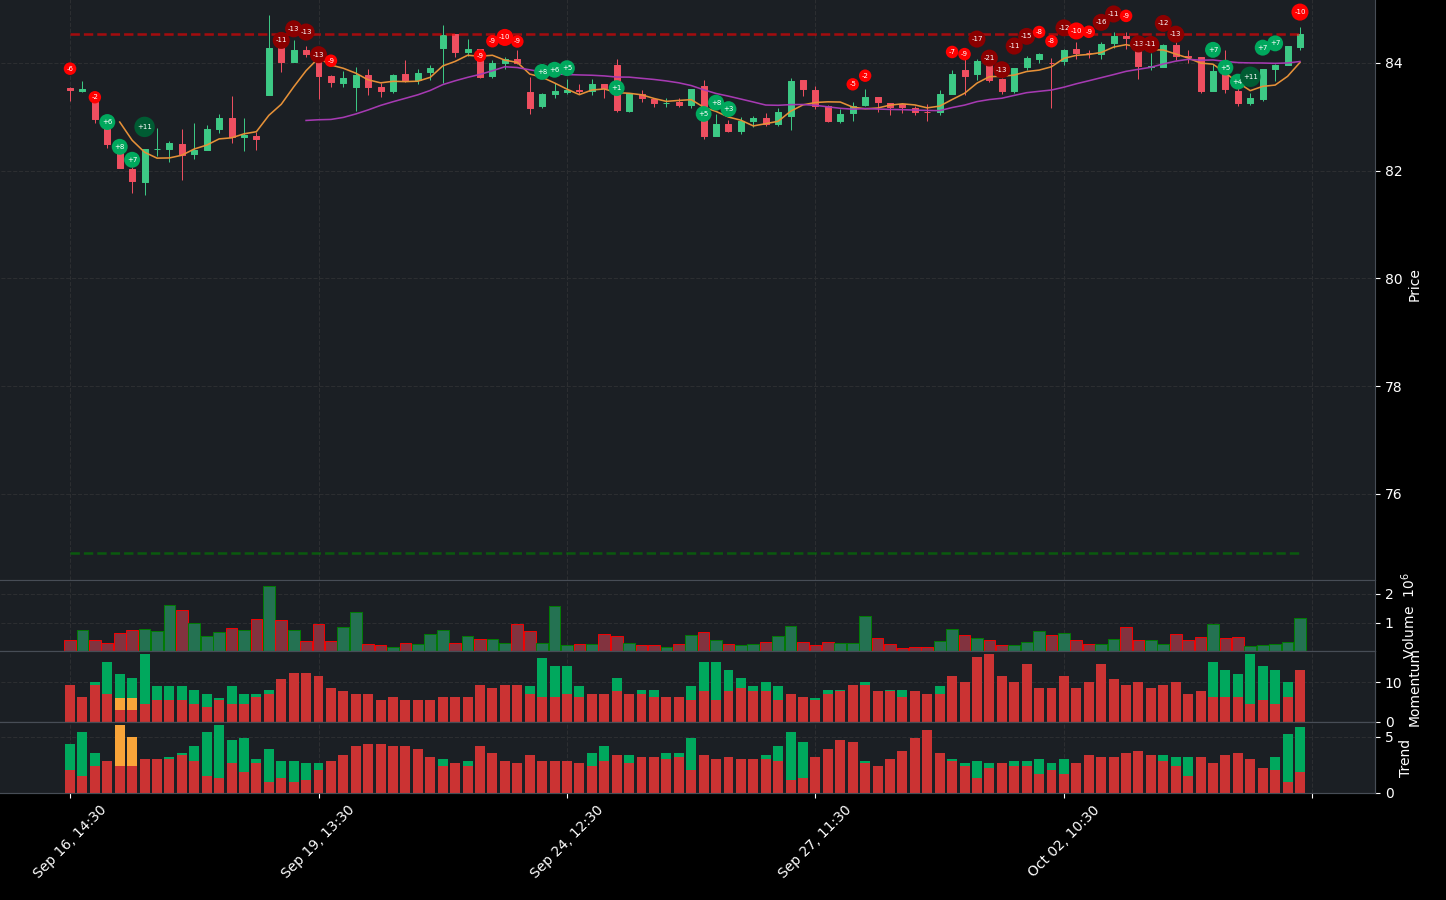
BSX Price Analysis
| Positive Momentum Signals | Negative Momentum Signals | Hold Momentum Signals |
|---|---|---|
|
|
|
| Positive Trend Signals | Negative Trend Signals | Hold Trend Signals |
|---|---|---|
|
|
|
BSX stock presents a complex financial picture, characterized by both positive and negative indicators. Currently, the stock is rated a strong sell, reflecting significant concerns about its future performance.
On the positive side, there are some momentum indicators suggesting a potential turnaround. The WaveTrend indicator shows that the stock is oversold, indicating a possible bottom. Additionally, the stock is trading above both the 50-day EMA and the 200-day EMA, which are signs of a bullish trend. The OBV (On-Balance Volume) is increasing and shows high volume, further supporting the notion of a strengthening bullish trend. The Supertrend indicator also confirms a bullish trend, as the price is above the Supertrend line.
However, these positive signals are overshadowed by several negative momentum and trend indicators. The OBV shows bearish divergence, which has been confirmed, indicating that despite increasing prices, the volume does not support this upward movement. Similarly, the MFI (Money Flow Index) and StochRSI also exhibit bearish divergence, suggesting that the stock may be losing momentum. Furthermore, the presence of strong resistance levels poses a significant challenge for the stock to maintain its upward trajectory.
In summary, while BSX stock has some positive indicators that suggest potential for recovery, the overwhelming presence of bearish signals and strong resistance levels raises serious concerns. Investors should approach this stock with caution, as the current indicators suggest a strong sell recommendation until clearer signs of a sustainable recovery emerge.
BSX Fundamental Analysis
BSX’s recent financial performance presents a mixed picture, with several concerning indicators that warrant careful consideration. The company reported a net income of $324 million for the most recent period; however, the year-over-year trend shows a decrease, raising questions about its future profitability. Additionally, BSX carries a high average net debt of $8.15 billion, which could impact its financial flexibility and ability to service this debt.
Liquidity appears to be a significant concern, as evidenced by a low current ratio of 0.67, indicating potential challenges in meeting short-term obligations. Furthermore, the cash to total assets ratio is only 0.04, suggesting limited financial flexibility and increased vulnerability to economic downturns.
From a valuation perspective, BSX’s forward P/E ratio stands at 30.97, which may indicate that the stock is overvalued. The price-to-sales ratio is also elevated at 8.17, reinforcing the notion that the stock might not be priced appropriately relative to its sales.
On a more positive note, BSX has demonstrated moderate year-over-year revenue growth of 6.85%, which could positively influence the stock price. The operating margin is exceptionally high at 100.00%, reflecting efficient operations and effective cost control. However, the net profit margin is relatively low at 7.86%, which could be a concern for investors regarding overall profitability.
Shareholder information reveals a solid investor base, with an average of 1.47 billion ordinary shares outstanding. The presence of 263 million treasury shares suggests potential share buyback activity, which could signal management’s confidence in the company’s future prospects.
Examining the income statement, total revenue for the most recent period was $4.12 billion, indicating a robust revenue base. However, the average dilution of earnings per share is concerning, as it may negatively impact shareholder value. Additionally, the company reported negative net interest income of $77 million, indicating that it is paying more in interest than it is earning on its assets.
The balance sheet shows a high debt-to-equity ratio of 53.06, indicating significant financial leverage and potential risk. The average tangible book value is negative at $578.8 million, raising concerns about the company’s net worth. While the average total debt is $10.04 billion, further analysis is needed to understand its composition and terms.
On the cash flow front, BSX’s average capital expenditures of $585.5 million suggest that the company is investing in growth and expansion. Positive net cash from financing at $4.85 billion indicates that the company is raising capital, which could be utilized for growth initiatives or debt reduction. Additionally, stock repurchases of $133.75 million can be viewed as a positive signal, as they reduce the number of shares outstanding and may enhance earnings per share.
In summary, while BSX exhibits some positive indicators such as revenue growth and efficient operations, the high levels of debt, low liquidity, and potential overvaluation raise significant concerns. Therefore, the overall recommendation is neutral. Investors should proceed with caution and thoroughly evaluate the company’s ability to navigate its financial challenges before making any investment decisions.
Financial Health
🔴 Net Income for the most recent period was $324 million, but the year-over-year net income trend shows a decrease, raising concerns about future profitability.
🔴 The average net debt is high at $8.15 billion, which warrants further investigation into its impact on financial flexibility and debt servicing.
🔴 The current ratio is low at 0.67, indicating potential liquidity risk and challenges in meeting short-term obligations.
🔴 The cash to total assets ratio is only 0.04, suggesting limited financial flexibility and vulnerability to economic shocks.
Valuation
🔴 The forward P/E ratio is high at 30.97, indicating potential overvaluation of the stock.
🔴 The price-to-sales ratio is also elevated at 8.17, suggesting that the stock may be overvalued relative to its sales.
Growth and Profitability
🟢 Year-over-year revenue growth of 6.85% indicates moderate growth, which could positively influence the stock price.
🔴 The net profit margin is low at 7.86%, which could be a concern for investors regarding profitability.
🟢 Operating margin is exceptionally high at 100.00%, suggesting efficient operations and good cost control.
Shareholder Information
🟢 The average ordinary shares outstanding is 1.47 billion, indicating a significant investor base.
🟢 The presence of 263 million treasury shares suggests potential share buyback activity, which could signal management’s confidence in future prospects.
Income Statement
🟢 Total revenue for the most recent period was $4.12 billion, showing a solid revenue base.
🔴 The average dilution of earnings per share is concerning, as it may affect shareholder value.
🔴 Net interest income is negative at $77 million, indicating that the company is paying more in interest than it is earning on its assets.
Balance Sheet
🔴 The debt-to-equity ratio is high at 53.06, indicating significant financial leverage and potential risk.
🔴 The average tangible book value is negative at $578.8 million, which raises concerns about the company’s net worth.
🟢 The average total debt is $10.04 billion, but further analysis is needed to understand its composition and terms.
Cashflow
🟢 Average capital expenditures of $585.5 million suggest that the company is investing in growth and expansion.
🟢 Positive net cash from financing at $4.85 billion indicates that the company is raising capital, which could be used for growth or debt reduction.
🟢 Stock repurchases of $133.75 million can be a positive signal, as they reduce the number of shares outstanding and may boost earnings per share.
Overall, while there are some positive indicators such as revenue growth and efficient operations, the high levels of debt, low liquidity, and potential overvaluation raise concerns. Therefore, the recommendation is neutral.
BSX News Analysis
Boston Scientific (BSX) shows a mixed performance with some positive indicators but also some concerns regarding its market position.
Summary of BSX news indicates that while Boston Scientific has experienced some positive movements, it is still lagging behind the broader market. The company has announced a conference call to discuss its upcoming quarterly results, which could provide more insights into its performance. Investors should weigh the mixed signals before making decisions.
🟢 Boston Scientific (BSX) has seen a rise in its stock price, although it still lags behind the overall market performance.
🔴 The article highlights that despite the rise, BSX’s performance is not as strong as that of its competitors, which may raise concerns for investors.
🟢 Another article suggests that investors should consider adding BSX to their portfolios, indicating some confidence in the company’s future prospects.
🔴 However, the mixed performance and the need for further clarity from the upcoming conference call could create uncertainty.
🟢 The announcement of the conference call discussing third-quarter results could provide crucial insights into the company’s financial health and future strategies.
BSX Holders Analysis
The stock of BSX presents a mixed outlook for the next month, with strong institutional support but concerning insider ownership dynamics.
🟢 BSX has a **high institutional ownership** at **92.75%**, indicating significant interest from large investors, which typically suggests confidence in the company’s future performance. This level of institutional backing can provide stability and support for the stock price.
🟡 The **very low insider ownership** of **0.18%** raises some concerns. This could indicate a lack of confidence from company management or a high degree of external control, which may not be favorable for long-term growth.
🟡 Recent insider transactions show a **mix of sales and purchases**, with a notable amount of selling in the past months. This could be interpreted as insiders taking profits, which might signal caution for potential investors.
🟢 The number of institutional holders is substantial at **1897**, suggesting a **diversified ownership base** that can mitigate volatility. This widespread interest from institutions can be a positive sign for the stock’s resilience.
🔴 The **high institutional ownership** could lead to increased volatility if these investors decide to sell, especially in response to market fluctuations or company performance issues.
BSX Analyst Ratings
The analyst ratings for BSX have shown a strong positive trend, with a significant number of analysts recommending either a buy or strong buy. In the last month, there were 10 strong buy ratings, 8 buy ratings, and only 6 hold ratings, indicating a bullish sentiment among analysts. 🟢 The recent upgrades from Evercore ISI Group and Raymond James reinforce this positive outlook.
In the past three months, the consistency of strong buy and buy ratings suggests that analysts are confident in the company’s performance. The absence of sell or strong sell ratings further supports this positive sentiment.
BSX Economic Analysis
Based on the US economic and market data:
🟢 The recent Non-Farm Payroll data shows a slight increase in employment, with 158,445 jobs added in July, indicating a stable labor market. This can lead to increased consumer spending, which is beneficial for companies like Boston Scientific that operate in the healthcare sector.
🟢 The unemployment rate has risen slightly to 4.3%, but it remains relatively low, suggesting that the labor market is still healthy. A stable employment environment typically supports healthcare spending, which is crucial for Boston Scientific’s growth.
🟡 Retail sales have shown a positive trend, with an increase to 627,510 in July. This indicates that consumers are willing to spend, which can translate into higher demand for medical devices and services offered by Boston Scientific.
🔴 The CPI data indicates inflationary pressures, with the latest reading at 314.540. While this could lead to increased costs for Boston Scientific, the overall demand for healthcare services tends to remain resilient during inflationary periods.
🟢 The company’s fundamentals remain strong, with a trailing PE ratio of 68.73 and a forward PE of 30.97, indicating growth potential. The target mean price for BSX is 88.43, suggesting a potential upside from the current price of 84.54.
In summary, while there are some inflationary concerns, the overall economic indicators suggest a stable environment for Boston Scientific. The company’s growth prospects and the healthcare sector’s resilience support a positive outlook for the next month.
Disclaimer
Investors may consider the AI predictions and news summaries as one factor in their investment decisions alongside their own research and risk tolerance.


