
ED Stock Analysis: A Cautious Buy Amid Mixed Signals
🔴 Recommendation: ED is currently rated as a buy, but investors should approach with caution due to a mix of positive and negative indicators.
📈 Key Highlights:
Momentum Indicators: Several indicators suggest that ED may be oversold, presenting a potential buying opportunity as it touches or moves outside the lower band.
Trend Indicators: The Supertrend indicator is bullish, but recent price action shows a breakdown below the lower band, indicating possible bearish trends.
Financial Health: Concerns arise from a high Debt-to-Equity Ratio of 1.19 and a low Current Ratio of 0.48, suggesting liquidity risks.
⚠️ Caution Flags:
Negative Earnings Trend: A year-over-year revenue decline of -24.77% raises alarms about future profitability.
Analyst Sentiment: Multiple analysts have adjusted their price targets downward, reflecting a lack of confidence in the stock’s performance.
As we delve deeper into the analysis, we will explore the price trends, indicators, financial health, valuation metrics, and more to provide a comprehensive view of Consolidated Edison (ED) and its potential for investors. Stay tuned for the detailed breakdown below! 👇
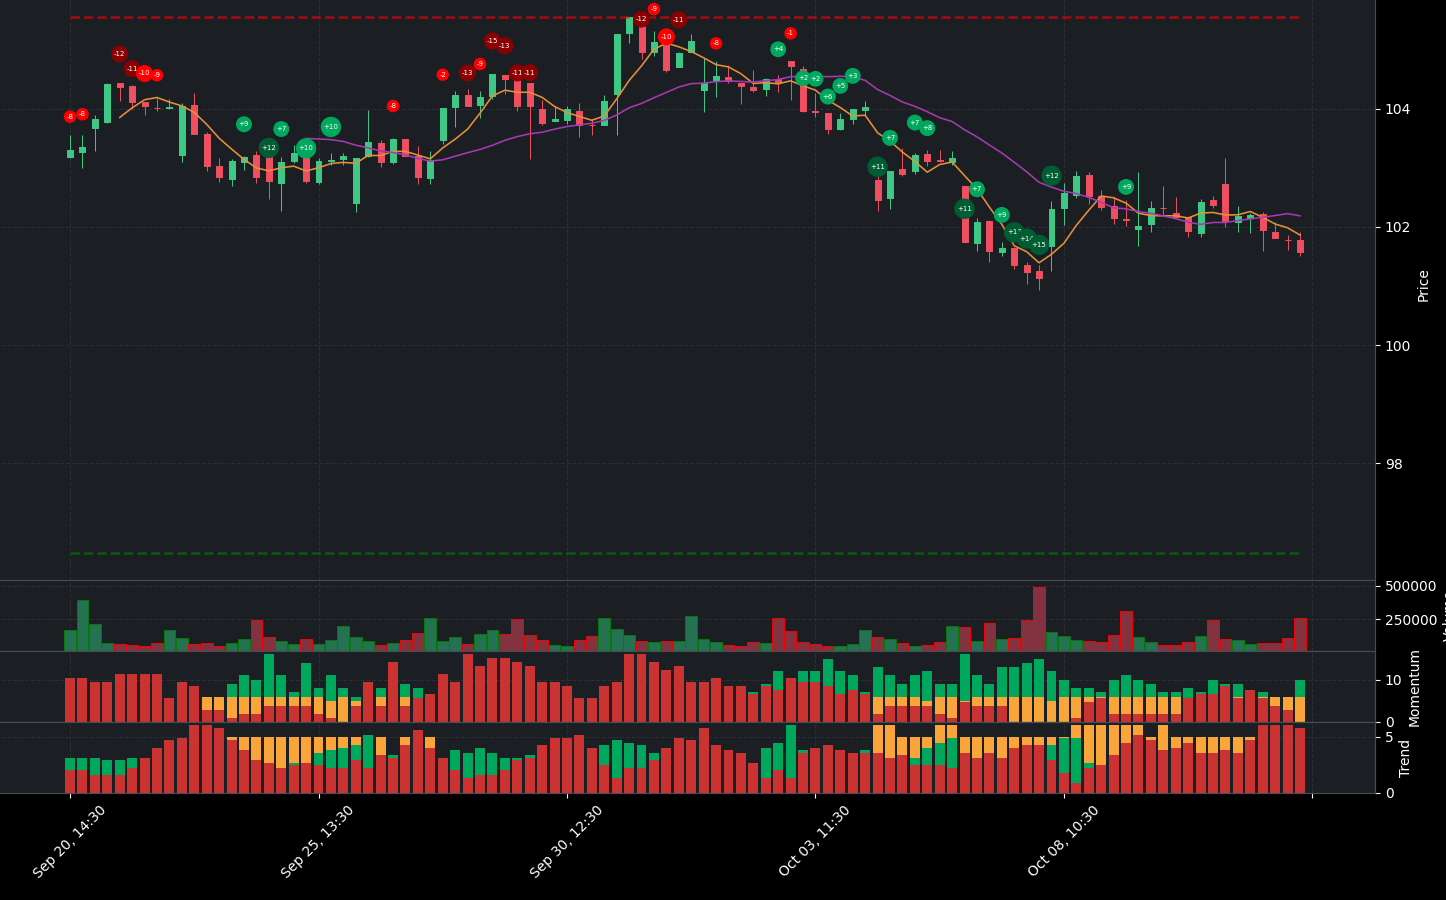
ED Price Analysis
| Positive Momentum Signals | Negative Momentum Signals | Hold Momentum Signals |
|---|---|---|
|
|
| Positive Trend Signals | Negative Trend Signals | Hold Trend Signals |
|---|---|---|
|
|
|
ED stock presents a complex picture for investors, characterized by both positive and negative indicators. Currently, the stock is rated as a buy, suggesting potential upside despite some concerning trends.
On the positive side, several momentum indicators are signaling a potential rebound. The stock is touching or outside the lower band, indicating it may be oversold and presenting a buying opportunity. Additionally, the Money Flow Index (MFI) shows a bullish divergence, while the Stochastic RSI and WaveTrend indicators also confirm an oversold condition, hinting at a potential bottom.
Trend indicators are mixed but lean towards the positive. The Supertrend indicator is currently bullish, with the price trading above it, suggesting a favorable trend. However, caution is warranted as the stock has recently experienced a price breakdown below the lower band on high volume, which could indicate the start of a new bearish trend. This is further supported by the On-Balance Volume (OBV) showing a decreasing trend, and the stock is trading below both the 50-day and 200-day Exponential Moving Averages (EMAs), indicating a strengthening bearish trend.
In summary, while ED stock shows some promising signs of recovery with its oversold momentum indicators and a bullish Supertrend, the recent price action and bearish trend indicators suggest that investors should proceed with caution. A buy recommendation is appropriate, but it is advisable to monitor the stock closely for any signs of further weakness or a potential reversal in trend. Setting stop-loss orders above recent highs could help mitigate risks associated with this investment.
ED Fundamental Analysis
ED’s recent financial performance presents a mixed picture, with several concerning indicators that potential investors should carefully consider.
The company’s net income for the most recent period stands at $202 million; however, the year-over-year trend shows a significant decrease, raising alarms about future profitability. Compounding this issue is a high debt-to-equity ratio of 1.19, which suggests substantial financial leverage and potential risk. Additionally, the current ratio is low at 0.48, indicating possible liquidity challenges in meeting short-term obligations. The cash to total assets ratio is alarmingly low at 0.02, reflecting limited financial flexibility and increased vulnerability to economic downturns.
From a valuation perspective, the price-to-sales ratio of 2.37 indicates potential overvaluation, as it exceeds the typical threshold of 2. The forward P/E ratio of 18.07 further suggests that the stock may be priced high relative to its earnings growth potential, which could deter value-oriented investors.
In terms of growth and profitability, the company has experienced a troubling year-over-year revenue decline of 24.77%, which could negatively impact stock price and investor sentiment. The net profit margin of 6.27% is relatively low, raising concerns about the company’s ability to generate profits after accounting for expenses. On a more positive note, the operating margin of 100.00% indicates efficient operations and effective cost control, which is a bright spot in an otherwise concerning financial landscape.
Shareholder information reveals an average of 345,283,154 ordinary shares outstanding, which may pose a dilution risk if new shares are issued. However, the presence of 33,950,792 average treasury shares suggests management’s confidence in the company’s future prospects through share buybacks.
The income statement reflects the negative trends in net income and revenue growth, which are concerning for sustainability. Nevertheless, the operating margin of 100.00% highlights operational efficiency.
On the balance sheet, the average net debt is high at $23.21 billion, warranting further scrutiny regarding its impact on financial flexibility. The high debt-to-equity ratio and low current ratio further emphasize potential liquidity issues.
Cash flow analysis reveals a troubling negative free cash flow of -$1.88 billion, raising questions about the company’s ability to fund operations and invest in growth. However, the average capital expenditures of $4.13 billion indicate that the company is still investing in growth and expansion, which is a positive sign. Additionally, positive net cash from financing activities suggests that the company is raising capital, potentially for growth or debt reduction.
In summary, while ED demonstrates operational efficiency, it faces significant challenges in revenue growth, profitability, and overall financial health. The high debt levels and liquidity concerns warrant caution for potential investors. A thorough evaluation of the company’s ability to navigate these challenges is essential before considering any investment.
Financial Health
🔴 Net Income for the most recent period was $202 million, but the year-over-year trend shows a decrease, raising concerns about future profitability.
🔴 The Debt-to-Equity Ratio is high at 1.19, indicating significant financial leverage and potential risk.
🔴 Current Ratio is low at 0.48, suggesting potential liquidity risk and challenges in meeting short-term obligations.
🔴 Cash to Total Assets Ratio is very low at 0.02, indicating limited financial flexibility and vulnerability to economic shocks.
Valuation
🔴 Price-to-Sales Ratio of 2.37 suggests potential overvaluation, as it is above the typical threshold of 2.
🔴 Forward P/E ratio of 18.07 indicates that the stock may be priced high relative to its earnings growth potential.
Growth and Profitability
🔴 Year-over-year revenue growth was -24.77%, indicating a significant decline in revenue, which could negatively impact stock price.
🔴 Net Profit Margin of 6.27% is relatively low, raising concerns about the company’s ability to generate profits after expenses.
🟢 Operating Margin of 100.00% suggests efficient operations and good cost control, which is a positive sign.
Shareholder Information
🔴 Average Ordinary Shares Outstanding is 345,283,154, which may indicate dilution risk if new shares are issued.
🟢 Average Treasury Shares of 33,950,792 could indicate management’s confidence in the company’s future prospects through share buybacks.
Income Statement
🔴 The negative trend in net income and revenue growth is concerning, indicating potential challenges in sustaining profitability.
🟢 Operating Margin of 100.00% reflects efficient operations, which is a positive aspect of the income statement.
Balance Sheet
🔴 Average Net Debt is high at $23.21 billion, warranting further investigation into its impact on financial flexibility.
🔴 The high Debt-to-Equity Ratio of 1.19 raises concerns about the company’s financial risk profile.
🔴 Current Ratio of 0.48 indicates potential liquidity issues, which could pose challenges in meeting short-term obligations.
Cashflow
🔴 Free Cash Flow is negative at -$1.88 billion, raising concerns about the company’s ability to fund operations and invest in growth.
🟢 Average Capital Expenditures of $4.13 billion suggest that the company is investing in growth and expansion, which is a positive sign.
🟢 Positive net cash from financing activities indicates that the company is raising capital, which could be used for growth or debt reduction.
Overall, the company shows signs of operational efficiency but faces significant challenges in revenue growth, profitability, and financial health. The high debt levels and liquidity concerns warrant caution for potential investors.
ED News Analysis
Consolidated Edison (ED) faces a challenging outlook based on recent news, with multiple analysts adjusting their price targets downward and maintaining negative ratings.
Summary of news regarding Consolidated Edison, Inc. (ED) indicates a negative sentiment among analysts, with price target reductions and a lack of bullish indicators. Investors should be cautious as the stock may struggle in the near term.
🔴 Goldman Sachs has adjusted its price target on Consolidated Edison to $97 from $91 while maintaining a sell rating. This indicates a lack of confidence in the stock’s performance and suggests potential further declines.
🔴 Guggenheim has also lowered its price target for Consolidated Edison to $91 from $96, reinforcing the negative sentiment surrounding the stock.
🔴 Jefferies initiated coverage on Consolidated Edison with a hold rating and a price target of $108, which is still below current trading levels, indicating limited upside potential.
🟢 On a slightly positive note, Consolidated Edison has a return on equity (ROE) of 8.3%, which may attract some investors looking for stable returns, although this is not enough to offset the negative outlook.
🟢 The company is set to present a webcast about its clean energy future, which could be a positive step towards improving its public image and attracting investment in sustainable initiatives.
🟢 With 70% institutional ownership, Consolidated Edison is favored by large investors, which may provide some support for the stock despite the negative analyst ratings.
🔴 Jim Cramer has expressed a bullish outlook on Consolidated Edison, but this sentiment is not widely reflected in the analyst community, suggesting that individual opinions may not align with broader market views.
ED Holders Analysis
The financial landscape for ED indicates a mixed outlook for the next month. While there are positive aspects regarding institutional ownership, the low insider ownership and recent insider transactions raise some concerns.
🟢 ED has a **high institutional ownership** at **70.35%**, which reflects significant interest from large investors. This could provide stability and support for the stock price in the near term.
🟡 The **low insider ownership** of **0.19%** suggests a potential lack of confidence from company management, which may lead to questions about the company’s future direction.
🟡 Recent insider transactions show a **higher number of sales** compared to purchases, indicating that insiders may not be optimistic about the stock’s short-term performance.
🟢 The number of institutional holders is substantial at **1518**, indicating a diversified ownership base that could mitigate volatility.
🔴 The **high institutional ownership** could also lead to increased volatility if large investors decide to sell, especially given the current market conditions.
🟡 Overall, the mixed signals from insider transactions and the low insider ownership suggest caution, despite the strong institutional backing.
ED Analyst Ratings
The analyst ratings for ED show a mixed sentiment, with a notable number of hold and sell recommendations. Over the past month, there have been 1 strong buy, 0 buy, 10 hold, 6 sell, and 0 strong sell ratings. This indicates a cautious outlook among analysts. 🔴 The recent upgrades and downgrades suggest that while there is some support for the stock, the overall sentiment leans towards caution, particularly with the number of hold and sell ratings.
🟡 In the upcoming month, the stock may experience limited movement, potentially fluctuating within a range of 1-3% based on current analyst sentiment. The mixed ratings suggest that investors should be prepared for volatility, and the medium confidence level indicates that while there is potential for stability, caution is advised.
ED Economic Analysis
Based on the US economic and market data:
🔴 The unemployment rate has increased to 4.3%, up from 4.1% in the previous month, indicating potential weakness in the labor market which could lead to reduced consumer spending and negatively impact Consolidated Edison, Inc. (ED).
🟡 Retail sales have shown a slight increase, but the overall growth rate is modest, suggesting that consumer demand is not robust enough to significantly boost utility revenues in the near term.
🟢 The GDP growth rate has remained stable, which is generally positive for the economy. However, the utility sector is less sensitive to GDP fluctuations compared to other sectors, so the impact on ED may be limited.
🔴 The recent increase in the Monthly Treasury Yield to 4.25% could lead to higher borrowing costs for utilities, which may affect their profitability and investment capabilities.
🟡 The overall market sentiment appears mixed, with no significant movements in major indices like NASDAQ and S&P 500, indicating a lack of strong momentum in either direction.
In summary, while there are some positive indicators, the increase in unemployment and rising treasury yields present challenges for ED. The stock price may remain relatively stable around the current level of 101.58, with a potential range of 99.5 to 104.0 over the next month. The dividend yield of 3.27% remains attractive for income-focused investors, but growth prospects appear limited in the short term.
Disclaimer
Investors may consider the AI predictions and news summaries as one factor in their investment decisions alongside their own research and risk tolerance.


