
ET Stock Analysis: A Mixed Bag of Signals!
🔴 Recommendation: Energy Transfer LP (ET) is currently flashing a cautious sell signal, with a blend of positive trends and concerning indicators that warrant careful consideration.
📈 Key Highlights:
Technical Indicators: ET is trading above both the 50-day and 200-day Exponential Moving Averages (EMAs), indicating a bullish trend. However, the stock is nearing resistance levels, which could limit further gains.
Financial Health: The company faces challenges with a negative Net Interest Income of $-762 million and a high Debt-to-Equity Ratio of 2.07, raising concerns about its financial risk profile.
Valuation Metrics: The Forward P/E ratio of 10.50 and a low Price-to-Sales Ratio of 0.67 suggest potential undervaluation, making it an attractive option for value investors.
⚠️ Caution Flags:
Decreasing Momentum: The On-Balance Volume (OBV) is declining, indicating that the volume of trades is not supporting the price increase, which could signal a potential correction.
Revenue Decline: Year-over-year revenue growth is down by -4.16%, which could negatively impact future stock performance.
As we delve deeper into the analysis, we’ll explore the price trends, financial health, valuation metrics, and the broader market context affecting ET’s outlook. Stay tuned for a comprehensive breakdown of what lies ahead for Energy Transfer LP! 👇
ET Price Analysis
| Positive Momentum Signals | Negative Momentum Signals | Hold Momentum Signals |
|---|---|---|
|
|
| Positive Trend Signals | Negative Trend Signals | Hold Trend Signals |
|---|---|---|
|
|
|
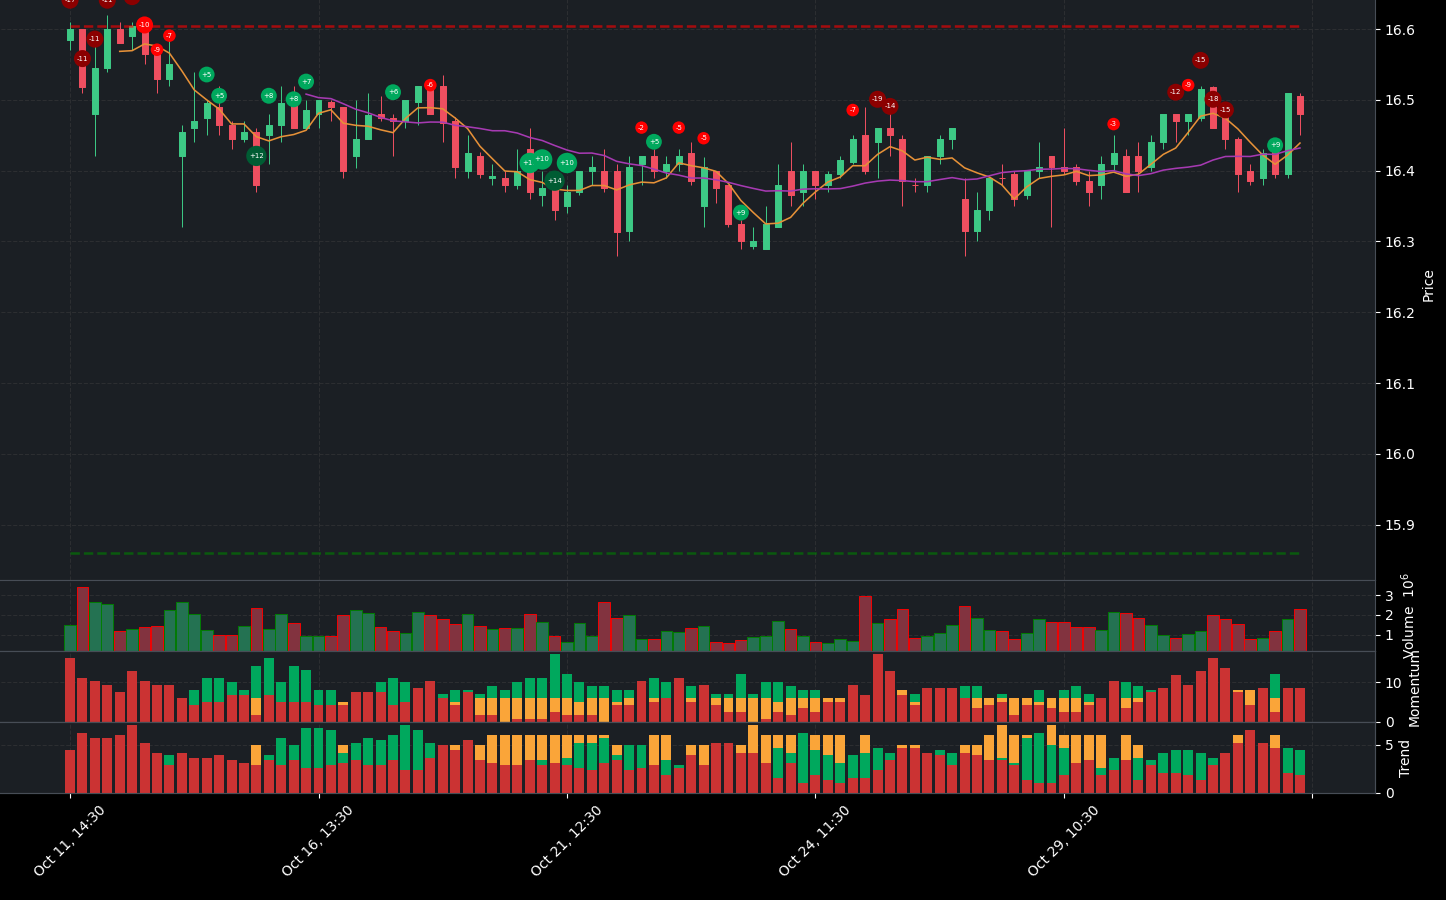
ET stock presents a complex picture for investors. Currently, the stock is positioned at a sell recommendation, reflecting a cautious outlook despite some positive indicators.
On the positive side, ET is exhibiting a bullish trend as it trades above both the 50-day and 200-day Exponential Moving Averages (EMAs), suggesting a strengthening bullish trend. Additionally, the price is above the Supertrend indicator, reinforcing the notion of upward momentum. However, investors should be wary as the stock is closer to resistance, which could limit further gains.
Despite these bullish signals, there are notable negative momentum indicators. The On-Balance Volume (OBV) is decreasing, indicating that the volume of trades is not supporting the price increase, which could be a warning sign. Furthermore, the high volume decreasing trend suggests that investor enthusiasm may be waning, potentially leading to a price correction.
In summary, while ET stock shows some positive trends, the decreasing OBV and its position near resistance warrant caution. Investors should consider a hold or sell strategy until clearer signals of sustained upward momentum emerge.
ET Fundamental Analysis
ET’s recent financial performance presents a mixed picture, with several concerning indicators overshadowing some positive aspects.
On the negative side, the company is grappling with significant financial challenges. The Net Interest Income is alarmingly negative at $-762 million, indicating that ET is paying more in interest on its debts than it is earning from its assets. This situation is compounded by a high Debt-to-Equity Ratio of 2.07, which raises serious concerns about the company’s financial risk profile and its ability to weather economic downturns. Additionally, the Current Ratio is low at 0.08, suggesting potential liquidity risks, as ET may struggle to meet its short-term financial obligations. The Cash to Total Assets Ratio is also very low at 0.01, indicating limited financial flexibility and increased vulnerability to economic shocks.
Despite these challenges, there are some positive indicators worth noting. The Forward P/E Ratio stands at 10.50, which is below the 15 threshold, suggesting potential future undervaluation. Similarly, the Price-to-Sales Ratio is low at 0.67, further indicating that the stock may be undervalued.
In terms of growth and profitability, ET reported a positive Net Income of $1.31 billion for the most recent period, showcasing profitability. However, the year-over-year revenue growth has declined by 4.16%, which could negatively impact the stock price moving forward. On a more positive note, the Operating Margin is impressively high at 98.42%, reflecting efficient operations and good cost control, although the Net Profit Margin is relatively low at 6.34%, which could be a concern for investors.
From a shareholder perspective, the average ordinary shares outstanding is stable at 3.28 billion, but the absence of average treasury shares may suggest limited buyback activity, which could impact shareholder value.
Examining the balance sheet reveals further concerns, with an average net debt of $51.22 billion and total debt of $52.75 billion, indicating significant leverage that warrants careful scrutiny regarding its impact on financial flexibility and debt servicing capabilities. However, the average tangible book value stands at $25.52 billion, representing the company’s net worth after liabilities.
On the cash flow front, ET shows some positive signs with average capital expenditures of $3.62 billion, indicating investment in growth and expansion. The company also has positive net cash from financing at $54.81 billion, suggesting it is raising capital, potentially for growth or debt reduction. Additionally, stock repurchases of $7.75 million can be seen as a positive signal, as they reduce the number of shares outstanding and may enhance earnings per share (EPS).
In summary, while ET exhibits some positive indicators such as profitability and valuation metrics suggesting potential undervaluation, the high debt levels and declining revenue growth raise significant concerns about the company’s financial health and future performance. Investors should approach ET with caution, carefully weighing the risks against the potential rewards before making any investment decisions.
Financial Health
🔴 Net Interest Income is negative at $-762 million, indicating the company is paying more in interest on its debts than it is earning on its assets.
🔴 The Debt-to-Equity Ratio is high at 2.07, raising concerns about the company’s financial risk profile and its ability to withstand economic downturns.
🔴 Current Ratio is low at 0.08, suggesting potential liquidity risk, as the company might face challenges in meeting its short-term financial obligations.
🔴 Cash to Total Assets Ratio is very low at 0.01, indicating limited financial flexibility and a higher vulnerability to economic shocks.
Valuation
🟢 Forward P/E ratio is at 10.50, which is below 15, suggesting potential future undervaluation.
🟢 Price-to-Sales Ratio is low at 0.67, indicating potential undervaluation.
Growth and Profitability
🟢 Net Income for the most recent period was positive at $1.31 billion, showing profitability.
🔴 Year-over-year revenue growth was -4.16%, indicating a decline in revenue, which could negatively impact the stock price.
🟢 Operating Margin is high at 98.42%, suggesting efficient operations and good cost control.
🔴 Net Profit Margin is low at 6.34%, which could be a concern for investors.
Shareholder Information
🟢 Average Ordinary Shares Outstanding is 3.28 billion, indicating a stable shareholder base.
🔴 Average Treasury Shares are 0, which may suggest limited buyback activity.
Income Statement
🟢 Net Income trend shows year-over-year increase, which is generally a positive sign.
🔴 Average Dilution Earnings indicate potential concerns regarding share dilution.
Balance Sheet
🔴 Average Net Debt is high at $51.22 billion, warranting further investigation into its impact on financial flexibility and ability to service debt obligations.
🔴 Average Total Debt is also high at $52.75 billion, indicating significant leverage.
🟢 Average Tangible Book Value is $25.52 billion, representing the net worth of the company after deducting liabilities from assets.
Cashflow
🟢 Average Capital Expenditures are $3.62 billion, suggesting the company is investing in growth and expansion.
🟢 Positive Net Cash from Financing at $54.81 billion indicates the company is raising capital, which could be used for growth or debt reduction.
🟢 Stock Repurchases of $7.75 million can be a positive signal as it reduces the number of shares outstanding and may boost earnings per share (EPS).
Overall, while there are some positive indicators such as profitability and valuation metrics suggesting potential undervaluation, the high debt levels and declining revenue growth raise concerns about the company’s financial health and future performance.
ET News Analysis
The news surrounding Energy Transfer LP (ET) presents a mixed outlook for investors. While there are positive developments regarding cash distributions, concerns about stock performance and external factors affecting energy projects could weigh on investor sentiment.
Summary of ET news indicates a blend of positive and negative factors impacting Energy Transfer LP. The announcement of an increase in quarterly cash distribution is a strong positive signal, suggesting financial stability and commitment to shareholders. However, the decline in stock price amidst improving market conditions raises concerns about investor confidence. Additionally, the uncertainty surrounding major energy projects due to political factors could further complicate the outlook.
🟢 Energy Transfer announces an increase in quarterly cash distribution, reflecting a commitment to returning value to shareholders.
🟢 The increase in distribution is a positive indicator of the company’s financial health and could attract income-focused investors.
🔴 However, Energy Transfer’s stock has been declining even as the broader market improves, indicating potential underlying issues or investor sentiment challenges.
🔴 The article discussing big energy projects hanging in the balance highlights the risks associated with regulatory and political factors that could impact ET’s operations.
🔴 Concerns about the upcoming earnings report from Marathon Petroleum, which is closely related to ET, could also affect investor sentiment towards ET.
🟢 The stock is currently trading at a discount compared to the industry, suggesting potential for recovery if market conditions stabilize.
ET Holders Analysis
The financial health and ownership structure of ET indicate a generally positive outlook for the next month, although some caution is warranted due to mixed signals from insider transactions.
🟢 ET has a **high insider ownership** of 10.08%, which suggests strong alignment of interests between management and shareholders. This is typically a positive sign for potential investors.
🟢 The **institutional ownership** stands at 33.19%, indicating a healthy mix of institutional and retail investors. The presence of 1172 institutional holders reflects widespread interest and diversification in ownership, which can stabilize the stock price.
🟡 Recent insider transactions show a mix of sales and purchases, with some significant insider selling observed. While this could raise concerns, it is important to note that these transactions may be part of planned divestitures rather than a lack of confidence in the company’s future.
🟢 The stock has shown resilience in its performance, and the backing from major institutional holders like Blackstone Inc. and Morgan Stanley suggests confidence in ET’s growth prospects.
🔴 However, the recent insider selling activity, particularly the large transactions, could indicate that insiders are capitalizing on current stock prices, which may lead to short-term volatility.
Overall, while the fundamentals and ownership structure support a **buy** recommendation, the mixed signals from insider transactions suggest that investors should proceed with caution.
ET Analyst Ratings
The analyst ratings for ET have shown a consistent positive trend over the past few months, with a significant number of analysts recommending either a buy or strong buy. In the last month, there were 7 strong buy ratings and 9 buy ratings, indicating a bullish sentiment among analysts. However, there were also 1 hold rating, which suggests some caution.
🟢 The recent upgrades from firms like RBC Capital and UBS reinforce the positive outlook for ET. The lack of sell or strong sell ratings further supports this sentiment.
🟡 Given the current analyst ratings and the overall positive sentiment, it is likely that the stock will perform well in the next month. However, the medium confidence level indicates that investors should remain vigilant and monitor market conditions closely.
ET Economic Analysis
Based on the US economic and market data:
🟢 The **unemployment rate** has increased slightly to **4.3%**, but this is still relatively low, indicating a stable labor market which supports consumer spending.
🟢 **Retail sales** have shown an increase to **627,510**, suggesting healthy consumer demand, which is beneficial for Energy Transfer LP as it operates in the energy sector.
🔴 The **CPI** remains high at **314.540**, indicating persistent inflationary pressures that could lead to increased operational costs for Energy Transfer LP.
🟢 The **GDP** growth rate remains strong at **5737.189**, which supports overall economic activity and energy demand.
🟡 The **monthly treasury yield** is at **4.25%**, which is relatively high but not alarming, indicating a stable interest rate environment that could support investment in energy infrastructure.
🟢 Energy Transfer LP has a **dividend yield** of **7.83%**, which is attractive for income-focused investors, especially in a volatile market.
Overall, while there are some inflationary concerns, the underlying economic indicators such as GDP growth and retail sales suggest a positive outlook for Energy Transfer LP over the next month. The stock is currently trading at **16.48**, with a target mean price of **19.59**, indicating potential upside.
Disclaimer
Investors may consider the AI predictions and news summaries as one factor in their investment decisions alongside their own research and risk tolerance.


