
FIS Stock Analysis: A Mixed Outlook for Investors
🔴 Recommendation: FIS stock presents a complex picture for investors, currently rated as a buy, but with several cautionary indicators that warrant careful consideration.
📈 Key Highlights:
Momentum Indicators: The stock shows positive momentum with a bullish crossover in the StochRSI and a confirmed buy signal from the WaveTrend indicator, indicating potential for upward movement.
Trend Strength: FIS is trading above both the 50-day and 200-day EMAs, suggesting a strengthening bullish trend, while the On-Balance Volume (OBV) indicates increasing trends and high volume activity.
Financial Health: Despite a Net Profit Margin of 9.72% and a Current Ratio of 0.82, the company demonstrates operational efficiency with a remarkable Operating Margin of 100.00%.
⚠️ Caution Flags:
Debt Concerns: An average net debt of $14.25 billion raises questions about financial flexibility, and a Debt-to-Equity Ratio of -2.82 suggests high leverage.
Market Sentiment: Recent adjustments to price targets and a bearish Supertrend indicator indicate potential resistance levels that could limit upside potential.
As we delve deeper into the analysis, we will explore the price trends, detailed indicators, financial health, valuation metrics, and more to provide a comprehensive view of FIS stock and its potential for investors. Stay tuned for an in-depth breakdown! 👇
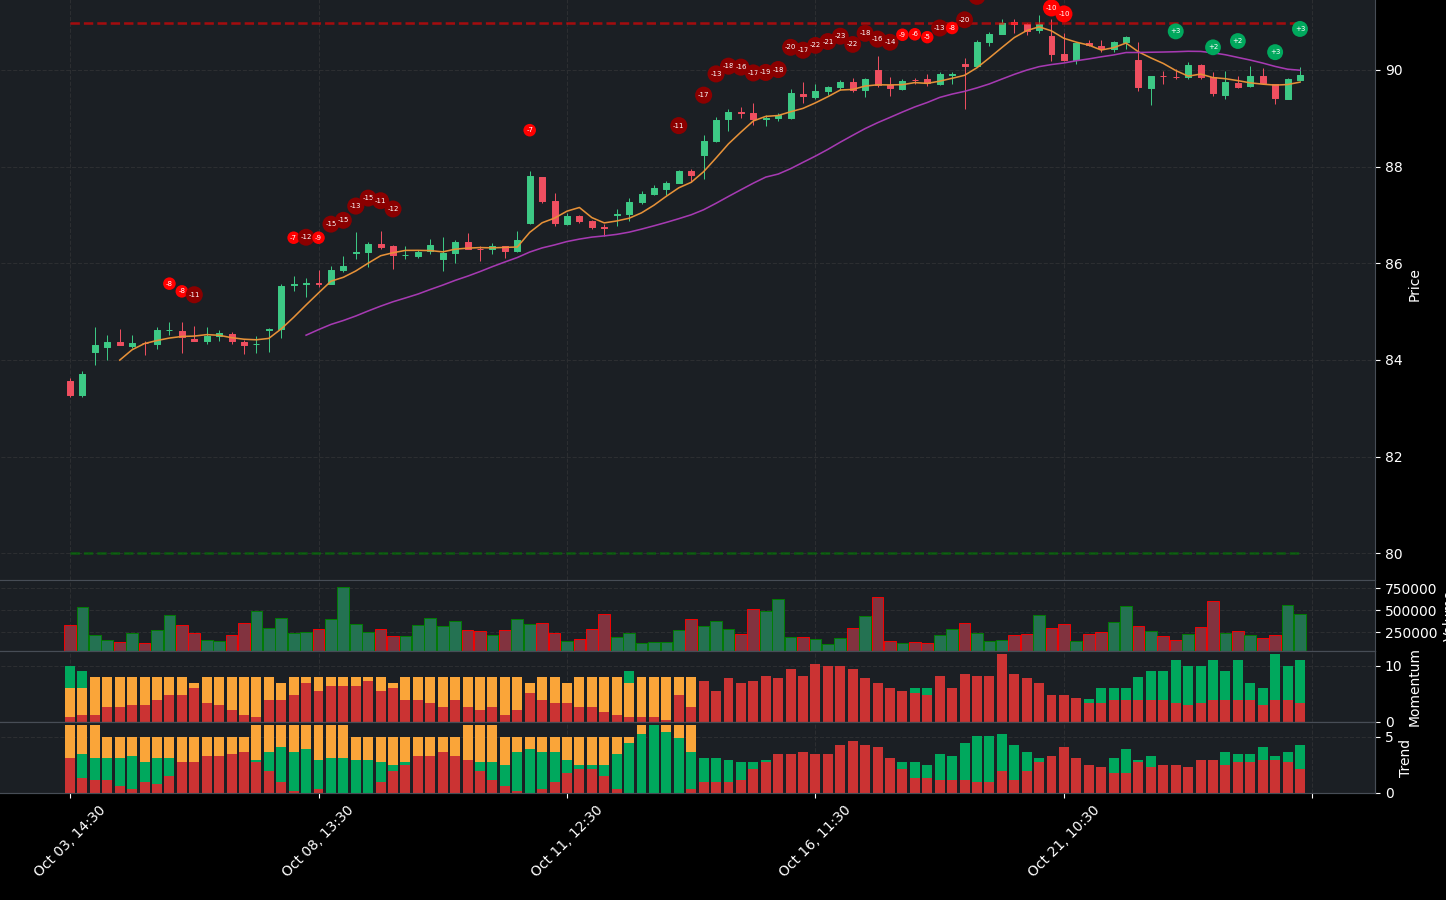
FIS Price Analysis
| Positive Momentum Signals | Negative Momentum Signals | Hold Momentum Signals |
|---|---|---|
|
|
|
| Positive Trend Signals | Negative Trend Signals | Hold Trend Signals |
|---|---|---|
|
|
|
FIS stock presents a complex picture for investors, characterized by both positive and negative indicators. On the positive side, the stock is currently rated as a buy, supported by several momentum indicators. Notably, the StochRSI shows a bullish crossover, and the WaveTrend indicator confirms a buy signal while also indicating that the stock is in an oversold condition, suggesting a potential bottom.
Trend indicators further bolster the bullish outlook, with the On-Balance Volume (OBV) showing increasing trends and high volume activity. Additionally, the stock price is above both the 50-day and 200-day Exponential Moving Averages (EMAs), indicating a strengthening bullish trend. The MACD has also shown a positive histogram crossover, reinforcing the positive momentum.
However, caution is warranted due to some negative indicators. The stock is currently closer to resistance levels, which could limit upside potential. Furthermore, the price is below the Middle Band of its Bollinger Bands, indicating a downtrend, although it is above the Lower Band, suggesting oversold conditions. The Supertrend indicator is bearish, and the price is below this trend line, which adds to the cautionary stance.
In summary, while FIS stock exhibits several positive momentum and trend indicators, the proximity to resistance and bearish signals from the Supertrend and Bollinger Bands suggest that investors should proceed with caution. The current recommendation leans towards a buy, but investors should remain vigilant about potential resistance and market conditions that could impact performance.
FIS Fundamental Analysis
FIS’s recent financial performance presents a mixed outlook, highlighting both strengths and weaknesses that investors should carefully consider.
On the positive side, the company demonstrates operational efficiency with an impressive operating margin of 100.00%, indicating effective cost control and management of operations. Additionally, FIS has shown year-over-year revenue growth of 0.89%, suggesting moderate growth potential, which could bode well for future stock performance. The company also exhibits confidence in its future prospects through stock repurchases totaling $1.17 billion, which may enhance earnings per share.
However, several concerning factors cannot be overlooked. The net profit margin of 9.72% is relatively low, raising questions about the company’s overall profitability. Furthermore, FIS carries an average net debt of $14.25 billion, which could limit its financial flexibility and ability to meet debt obligations. The current ratio of 0.82 indicates potential liquidity risks, suggesting challenges in covering short-term financial commitments.
Valuation metrics also present a mixed picture. The forward P/E ratio of 15.94 suggests that the stock may be fairly valued relative to its earnings potential. However, the price-to-sales ratio of 4.93 is relatively high, indicating potential overvaluation when compared to revenue. Additionally, the company’s net interest income of -$43 million implies that it is paying more in interest than it is earning, which could further impact profitability.
From a balance sheet perspective, the debt-to-equity ratio of -2.82 raises concerns about high leverage, which may be unsustainable depending on the industry context. The average tangible book value of -$5.67 billion indicates negative net worth, which is alarming for the company’s financial health. Although the cash to total assets ratio of 0.04 suggests limited cash reserves, it is crucial to analyze the overall asset composition for a complete picture.
On the cash flow front, FIS shows promise with an average free cash flow of $2.40 billion, indicating healthy cash generation that can support operations and growth. The average capital expenditures of $1.22 billion also suggest that the company is investing in growth and expansion, which could lead to future revenue increases.
In summary, FIS presents a complex investment case. While operational efficiency and moderate growth are positive indicators, significant concerns regarding profitability, debt levels, and liquidity risk warrant caution. Investors should weigh these factors carefully and consider the company’s ability to navigate its challenges before making any investment decisions.
Financial Health
🔴 Net Profit Margin of 9.72% is relatively low, indicating potential challenges in profitability.
🔴 Average Net Debt of $14.25 billion raises concerns about financial flexibility and the ability to service debt obligations.
🔴 Current Ratio of 0.82 suggests potential liquidity risk, indicating challenges in meeting short-term financial obligations.
🟢 Operating Margin of 100.00% reflects efficient operations and good cost control, which is a positive sign for the company’s operational efficiency.
Valuation
🟢 Forward P/E ratio of 15.94 indicates the stock may be fairly valued relative to its earnings potential.
🔴 Price-to-Sales Ratio of 4.93 is relatively high, suggesting potential overvaluation compared to revenue.
Growth and Profitability
🟢 Year-over-year revenue growth of 0.89% indicates moderate growth, which could be a positive sign for future stock performance.
🔴 Net Interest Income of -$43 million suggests the company is paying more in interest than it is earning, which could impact profitability.
Shareholder Information
🟢 Stock Repurchases of $1.17 billion indicate management’s confidence in the company’s future prospects, potentially boosting earnings per share.
🔴 Average Ordinary Shares Outstanding of 575.8 million suggests potential dilution concerns if new shares are issued.
Income Statement
🟢 Net Income for the most recent period was $242 million, showing profitability despite the low net profit margin.
🔴 Year-over-year revenue growth of 0.89% is modest, indicating that growth may not be robust.
Balance Sheet
🔴 Debt-to-Equity Ratio of -2.82 suggests a high level of leverage, which may be unsustainable depending on the company’s industry and profitability.
🔴 Average Tangible Book Value of -$5.67 billion indicates negative net worth, raising concerns about the company’s financial health.
🟢 Cash to Total Assets Ratio of 0.04 indicates limited cash reserves, but it is essential to analyze the overall asset composition.
Cashflow
🟢 Average Free Cash Flow of $2.40 billion indicates healthy cash generation, which is a positive sign for funding operations and growth.
🟢 Average Capital Expenditures of $1.22 billion suggest the company is investing in growth and expansion, which could lead to future revenue increases.
Overall, the analysis presents a mixed picture of FIS, with both positive and negative factors influencing its financial health and stock performance. The company shows signs of operational efficiency and moderate growth, but concerns about profitability, debt levels, and liquidity risk warrant caution.
FIS News Analysis
FIS News: A mixed outlook for investors.
The news surrounding Fidelity National Information Services (FIS) presents a mixed outlook for investors. While there are positive developments regarding partnerships and awards, there are also adjustments to price targets and market performance ratings that may raise concerns. Investors should weigh these factors carefully before making decisions.
🟢 FIS is compared favorably against EFX in a value analysis, suggesting it may be a better investment option.
🔴 Bernstein has adjusted FIS’s price target down to $91 from $72, maintaining a market perform rating, which indicates a lack of strong bullish sentiment.
🟢 FIS’s treasury technology has won an award from IDC, highlighting its effectiveness and potential for future growth.
🟢 Goldman Sachs notes that FIS has a high consensus return on equity (ROE), which is a positive indicator of its profitability and efficiency.
🔴 FIS is set to report its third-quarter results on November 4, 2024, which may lead to volatility in the stock price leading up to the announcement.
🟢 Zacks describes FIS as a great momentum stock, suggesting that it may continue to perform well in the near term.
🔴 The overall sentiment from analysts appears cautious, with some suggesting that while FIS has potential, it may not be the best immediate investment compared to other options.
FIS Holders Analysis
The financial health of FIS shows a mixed outlook, with significant institutional ownership providing some stability, but low insider ownership and recent insider selling raise concerns.
🟢 FIS has a very high institutional ownership at 98.76%, indicating strong interest from large investors, which can provide a buffer against volatility. This level of institutional backing suggests confidence in the company’s long-term prospects.
🔴 However, the insider ownership is only 0.10%, which is considered very low. This could indicate a lack of confidence from management or a high degree of external control, potentially leading to misalignment between management and shareholder interests.
🟡 The number of institutional holders is substantial at 1407, indicating a diversified ownership structure. This can be a positive sign as it reduces the risk of significant price swings due to the actions of a few large shareholders.
🔴 Recent insider transactions show a pattern of selling, which could be interpreted as a lack of confidence in the stock’s future performance. The absence of insider purchases in the last six months further compounds this concern.
🟡 The stock has experienced fluctuations in the past months, and while institutional support is strong, the low insider ownership and selling activity suggest caution.
FIS Analyst Ratings
The analyst ratings for FIS show a generally positive outlook, with a notable number of strong buy and buy recommendations. Over the past month, there have been 9 strong buy ratings, 10 buy ratings, and 4 hold ratings, indicating a bullish sentiment among analysts. The absence of sell or strong sell ratings further supports this positive view. 🟢
However, the trend over the last three months shows a slight decline in the number of strong buy and buy ratings, which could indicate some caution. The recent upgrades from firms like Barclays and JP Morgan, maintaining their overweight ratings, suggest confidence in the stock’s potential.
In the next month, considering the current analyst sentiment and the lack of negative ratings, it is reasonable to expect FIS to perform well, potentially seeing a price increase of around 5-10%. However, the medium confidence level indicates that investors should remain vigilant for any changes in market conditions or analyst sentiment.
FIS Economic Analysis
Based on the US economic and market data:
🟢 The recent Non-Farm Payroll data shows an increase to 158,445 jobs, indicating a steady job market which can lead to increased consumer spending. This is positive for FIS as it operates in the financial services technology sector, benefiting from higher transaction volumes.
🔴 The unemployment rate has risen to 4.3%, which could signal potential economic weakness. However, this is still relatively low historically, and the labor market remains resilient.
🟢 Retail sales have increased to 627,510, suggesting strong consumer demand. This is beneficial for FIS as increased consumer spending can lead to higher transaction volumes and revenue from their payment processing services.
🟡 The CPI data shows inflation is stable, but the Federal Reserve’s interest rate decisions could impact borrowing costs for businesses, including FIS. A stable inflation rate is generally favorable for tech companies, but any unexpected hikes could pose risks.
🟢 The company’s fundamentals remain strong with a market cap of approximately 49 billion and a trailing PE ratio of 89. This indicates that while the stock may be considered overvalued, the growth potential in the financial technology sector remains robust.
Overall, while there are some mixed signals from the economic data, the positive indicators regarding job growth and retail sales suggest that FIS could see a favorable environment for growth in the coming month. The stock price may fluctuate but is likely to trend upwards, supported by strong consumer activity and the company’s solid market position.
Disclaimer
Investors may consider the AI predictions and news summaries as one factor in their investment decisions alongside their own research and risk tolerance.


