
INTC Stock Analysis: A Cautious Outlook Ahead!
🔴 Recommendation: Intel Corporation (INTC) is currently flashing a Strong Sell signal, with a concerning mix of negative indicators overshadowing any positives.
📈 Key Highlights:
Financial Health: Recent net income reported at a troubling -$1.61 billion, raising significant concerns about profitability.
Valuation: The forward P/E ratio of 21.23 suggests the stock may be overvalued relative to its earnings potential.
Growth: Year-over-year revenue growth is stagnating at just 0.86%, indicating potential challenges ahead.
⚠️ Caution Flags:
Negative Momentum: The WaveTrend indicator has issued a confirmed sell signal, and the On-Balance Volume is decreasing, suggesting bearish sentiment.
High Debt Levels: Average net debt stands at a concerning $42.28 billion, which could impact financial flexibility.
Weak Market Demand: Ongoing issues such as weak PC demand and intensified competition from rivals like AMD and Nvidia pose significant risks.
As we delve deeper into the analysis, we’ll explore the price trends, technical indicators, financial health, valuation metrics, and more to provide a comprehensive view of Intel’s current standing and future prospects. Stay tuned for the detailed breakdown below! 👇
INTC Price Analysis
| Positive Momentum Signals | Negative Momentum Signals | Hold Momentum Signals |
|---|---|---|
|
|
| Positive Trend Signals | Negative Trend Signals | Hold Trend Signals |
|---|---|---|
|
|
Intel Corporation (INTC) is currently facing a challenging financial landscape, as indicated by a strong sell recommendation. Despite some positive momentum indicators, the overall sentiment leans towards caution.
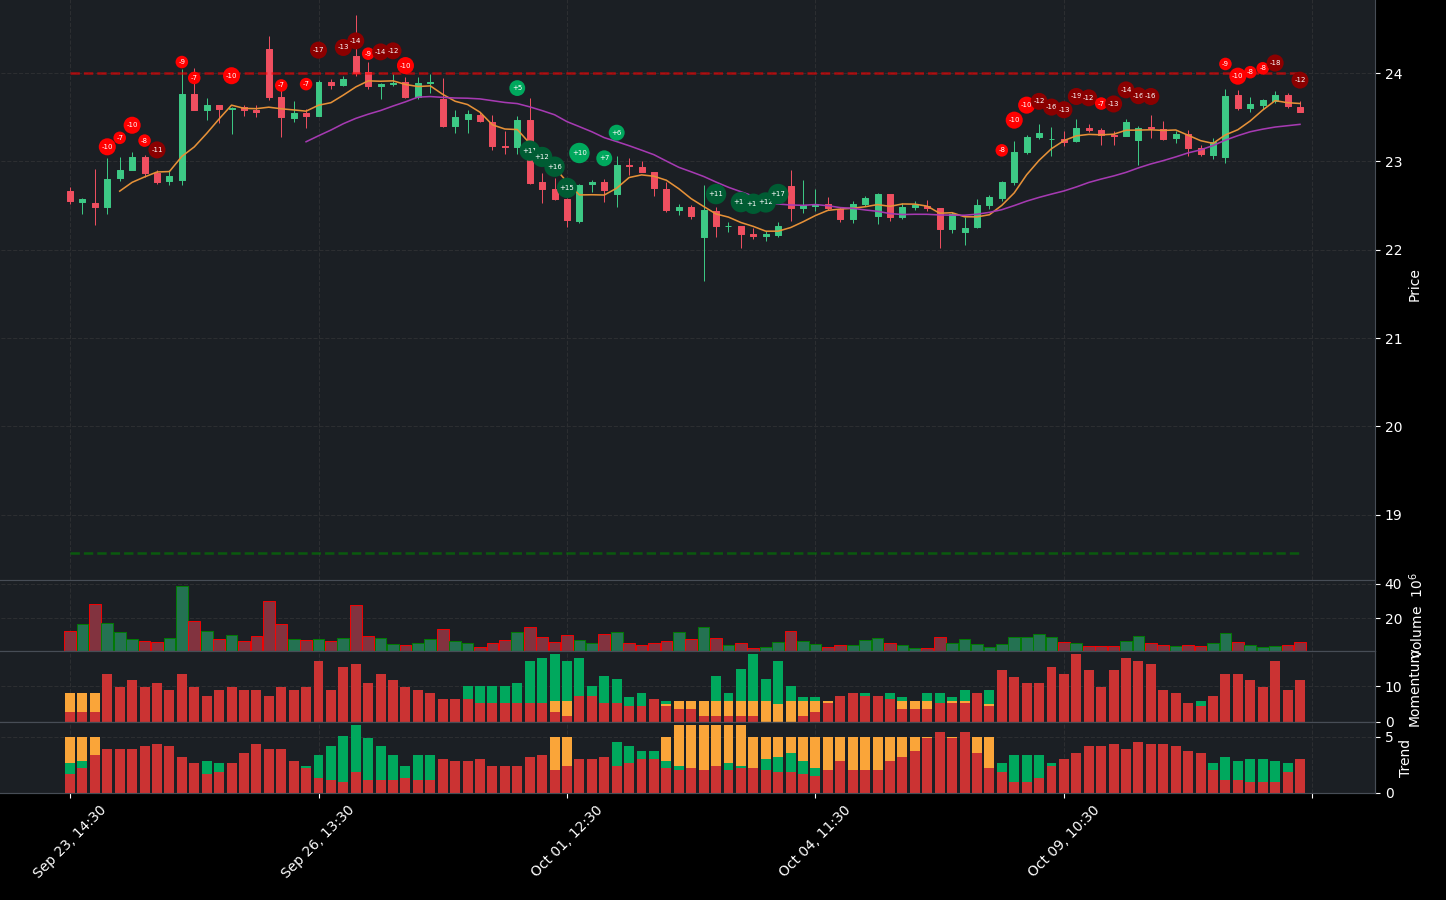
On the positive side, Intel’s stock price is above both the 50-day and 200-day Exponential Moving Averages (EMAs), suggesting a bullish trend in the long term. Additionally, the price is above the middle band of its Bollinger Bands, indicating that it is in an uptrend, although investors should be wary of potential overbought conditions. The Supertrend indicator also reflects a bullish trend, reinforcing the notion that the stock has been performing well in recent times.
However, several negative momentum and trend indicators raise significant concerns. The WaveTrend indicator has issued a confirmed sell signal, and the stock is positioned closer to resistance levels, which could limit further upward movement. The On-Balance Volume (OBV) is decreasing, suggesting that high volume is not supporting the current price levels, which is a bearish sign. Furthermore, the MACD has shown a negative histogram crossover, indicating potential weakness in momentum.
Given these mixed signals, investors should approach Intel with caution. The combination of a strong sell recommendation, decreasing OBV, and negative momentum indicators suggests that the stock may struggle to maintain its current price levels. Therefore, a strong sell recommendation is warranted until clearer signs of recovery or improvement in the company’s fundamentals emerge.
INTC Fundamental Analysis
Intel’s recent financial performance raises significant concerns for investors. The company reported a negative net income of $-1.61 billion for the most recent period, which raises serious questions about its profitability. This troubling trend is further highlighted by a year-over-year decrease in net income, potentially undermining investor confidence. The net profit margin stands at a concerning -12.55%, indicating significant challenges in managing costs and generating profits.
The company’s financial health is further compromised by a high average net debt of $42.28 billion, which could limit its financial flexibility and ability to meet debt obligations. Additionally, a low cash to total assets ratio of 0.04 suggests that Intel may be vulnerable to economic shocks, further straining its financial position.
From a valuation perspective, Intel appears to be overvalued, with a forward P/E ratio of 21.23 and a price-to-sales ratio of 1.83, indicating that the stock may not be justified based on its earnings potential and revenue generation capabilities.
Growth prospects are bleak, as evidenced by a minimal revenue growth of only 0.86% year-over-year, suggesting stagnation. The operating margin is negative at -7.96%, reflecting inefficiencies in operations and cost management. Alarmingly, the company also reported a negative free cash flow of -$10.41 billion, raising further concerns about its ability to fund operations and invest in future growth.
Shareholder information reveals that the average ordinary shares outstanding is high at 4.23 billion, which could dilute earnings per share and negatively impact shareholder value. Although the company has engaged in stock repurchases amounting to $4.16 billion, this may not be sufficient to counteract the dilution from share-based compensation.
On the income statement, total revenue for the most recent period was $12.83 billion, but the revenue growth trend is negative at -0.90%, indicating declining sales. The reported operating margin of 100.00% is misleading due to the negative net profit margin, suggesting that while operations may appear efficient, overall profitability is severely compromised.
The balance sheet shows a debt-to-equity ratio of 0.69, indicating a moderate level of leverage, but combined with high net debt, it raises concerns about financial risk. However, a current ratio of 2.63 indicates a healthy liquidity position, suggesting that the company can cover its short-term liabilities.
In terms of cash flow, the negative free cash flow of -$10.41 billion is alarming and could limit the company’s financial flexibility. On a positive note, there is a positive net cash from financing of $13.48 billion, indicating that the company is raising capital, which could be utilized for growth or debt reduction.
Overall, the combination of negative net income, low profit margins, high debt levels, and negative free cash flow presents a concerning picture for Intel, leading to a strong sell recommendation. Investors should exercise caution and thoroughly evaluate the company’s ability to navigate its challenges before considering any investment.
Financial Health
🔴 Net Income for the most recent period was negative at $-1.61 billion, raising significant concerns about the company’s profitability.
🔴 Year-over-year net income decreased, indicating a troubling trend that could affect investor confidence.
🔴 Net Profit Margin is at -12.55%, which is low and suggests challenges in controlling costs and generating profits.
🔴 Average Net Debt is high at $42.28 billion, which could impact financial flexibility and the ability to service debt obligations.
🔴 Cash to Total Assets Ratio is low at 0.04, indicating limited financial flexibility and vulnerability to economic shocks.
Valuation
🔴 Forward P/E ratio of 21.23 suggests the stock may be overvalued relative to its earnings potential.
🔴 Price-to-Sales Ratio of 1.83 indicates that the stock might be expensive compared to its revenue generation capabilities.
Growth and Profitability
🔴 Revenue Growth (YoY) is only 0.86%, which is minimal and suggests stagnation in growth.
🔴 Operating Margin is negative at -7.96%, indicating inefficiencies in operations and cost management.
🔴 Free Cash Flow is negative at -$10.41 billion, raising concerns about the company’s ability to fund operations and invest in growth.
Shareholder Information
🔴 Average Ordinary Shares Outstanding is high at 4.23 billion, which could dilute earnings per share and affect shareholder value.
🔴 Stock Repurchases of $4.16 billion may not be sufficient to offset the dilution from share-based compensation.
Income Statement
🔴 Total Revenue for the most recent period was $12.83 billion, but the revenue growth trend is negative at -0.90%, indicating declining sales.
🔴 Operating Margin of 100.00% is misleading due to the negative net profit margin, suggesting that while operations may appear efficient, the overall profitability is severely impacted.
Balance Sheet
🔴 Debt-to-Equity Ratio of 0.69 indicates a moderate level of leverage, but combined with high net debt, it raises concerns about financial risk.
🟢 Current Ratio of 2.63 indicates a healthy liquidity position, suggesting the company can cover its short-term liabilities.
Cashflow
🔴 Negative Free Cash Flow of -$10.41 billion is alarming and could limit the company’s financial flexibility.
🟢 Positive Net Cash from Financing of $13.48 billion indicates that the company is raising capital, which could be used for growth or debt reduction.
Overall, the combination of negative net income, low profit margins, high debt levels, and negative free cash flow presents a concerning picture for Intel, leading to a strong sell recommendation.
INTC News Analysis
Intel (INTC) faces a mixed outlook with both positive developments and significant challenges.
Summary of Intel news indicates a blend of optimism and caution for investors. Recent product advancements and updates suggest potential growth, but ongoing issues such as weak PC demand and competitive pressures from rivals like AMD and Nvidia could hinder performance. Investors should weigh these factors carefully.
🟢 Intel’s new PC chips are reported to address significant challenges, potentially enhancing their market position.
🟢 The article from Zacks questions whether Intel shares are worth another look, indicating a potential for recovery or growth.
🔴 However, Intel is ranked among the lowest in the UBS Quantamental Model for U.S. tech, trailing behind competitors like Arista and Broadcom, which raises concerns about its competitive edge.
🔴 Reports indicate that PC demand remains weak, which is not favorable for Intel and AMD, suggesting a challenging market environment.
🔴 Additionally, AMD’s recent AI chip launches intensify competition, putting pressure on Intel’s market share.
INTC Holders Analysis
The financial landscape for INTC presents a mixed picture, leading to a neutral recommendation for the next month. The high institutional ownership indicates confidence from large investors, but the very low insider ownership raises concerns about management’s commitment.
🟢 INTC has a substantial institutional ownership at **67.65%**, which reflects strong interest from large investors like Vanguard and Blackrock. This suggests a level of confidence in the company’s future performance.
🔴 However, the **0.06% insider ownership** is alarmingly low, indicating a potential lack of confidence from company management. This could lead to questions about the alignment of interests between management and shareholders.
🟡 The number of institutional holders is quite high at **3077**, which indicates a diversified ownership structure. This can provide stability but also means that any significant selling by these institutions could lead to increased volatility.
🟡 Recent insider transactions show minimal activity, with no significant purchases in the last six months. This lack of insider buying could be interpreted as a lack of confidence in the stock’s near-term performance.
🔴 The overall market sentiment for semiconductor stocks has been mixed, with some analysts expressing concerns about supply chain issues and competition. This could impact INTC’s stock performance in the coming month.
INTC Analyst Ratings
The analyst ratings for INTC show a mixed sentiment, with a total of 5 strong buy ratings, 18 buy ratings, 13 hold ratings, 3 sell ratings, and 2 strong sell ratings. This indicates a relatively balanced view among analysts, with a slight inclination towards buying. However, the recent downgrade from Mizuho from Outperform to Neutral and the consistent hold ratings from firms like Deutsche Bank and Benchmark suggest caution.
🟡 Over the past month, the ratings have fluctuated, with a notable increase in hold ratings and a decrease in strong buy recommendations. This indicates a shift in sentiment, possibly due to market conditions or company performance concerns.
🟢 Despite the mixed ratings, the overall sentiment leans towards a cautious optimism, suggesting that INTC may perform moderately well in the next month. However, the medium confidence level indicates that investors should remain vigilant and consider market trends and company news closely.
INTC Economic Analysis
Based on the US economic and market data:
🔴 The unemployment rate has increased to 4.3%, up from 4.1% in the previous month, indicating a potential slowdown in the labor market. This could lead to reduced consumer spending, negatively impacting demand for Intel’s products.
🟡 Retail sales have shown a slight increase, but the growth rate is modest, suggesting that consumer confidence may not be robust enough to drive significant increases in revenue for Intel.
🔴 The recent CPI data indicates persistent inflation, which could lead to further interest rate hikes by the Federal Reserve. Higher interest rates typically create a challenging environment for growth stocks like Intel, as borrowing costs rise and consumer spending may decline.
🟢 Despite these challenges, Intel’s strategic focus on AI and data center solutions may provide some resilience. The company has been investing heavily in these areas, which could lead to long-term growth opportunities.
Overall, while there are some positive aspects regarding Intel’s strategic direction, the current economic indicators suggest a cautious outlook for the next month. The stock price may remain volatile, with potential support around the 20-22 range and resistance near 25-26.
Disclaimer
Investors may consider the AI predictions and news summaries as one factor in their investment decisions alongside their own research and risk tolerance.


