
JNJ Stock Analysis: A Mixed Outlook Ahead!
🔴 Recommendation: Johnson & Johnson (JNJ) presents a complex financial picture, with both bullish and bearish indicators suggesting a cautious approach for investors.
📈 Key Highlights:
Profitability: Strong net income of $4.69 billion, reflecting robust profitability and operational efficiency.
Growth: Moderate revenue growth of 4.98% year-over-year, indicating potential for future performance.
Institutional Support: High institutional ownership at 72.68%, showcasing confidence from large investors.
⚠️ Caution Flags:
Legal Challenges: Ongoing insolvency case and bankruptcy issues could impact financial stability and investor sentiment.
Debt Concerns: Average net debt of $13.37 billion raises questions about financial flexibility.
Overvaluation Risks: Price-to-sales ratio of 4.46 may suggest the stock is somewhat overvalued compared to its revenue generation.
As we delve deeper into the analysis, we will explore the price trends, indicators, financial health, valuation metrics, and more to provide a comprehensive view of JNJ’s current standing and future potential. Stay tuned for the details! 👇
JNJ Price Analysis
| Positive Momentum Signals | Negative Momentum Signals | Hold Momentum Signals |
|---|---|---|
|
|
| Positive Trend Signals | Negative Trend Signals | Hold Trend Signals |
|---|---|---|
|
|
|
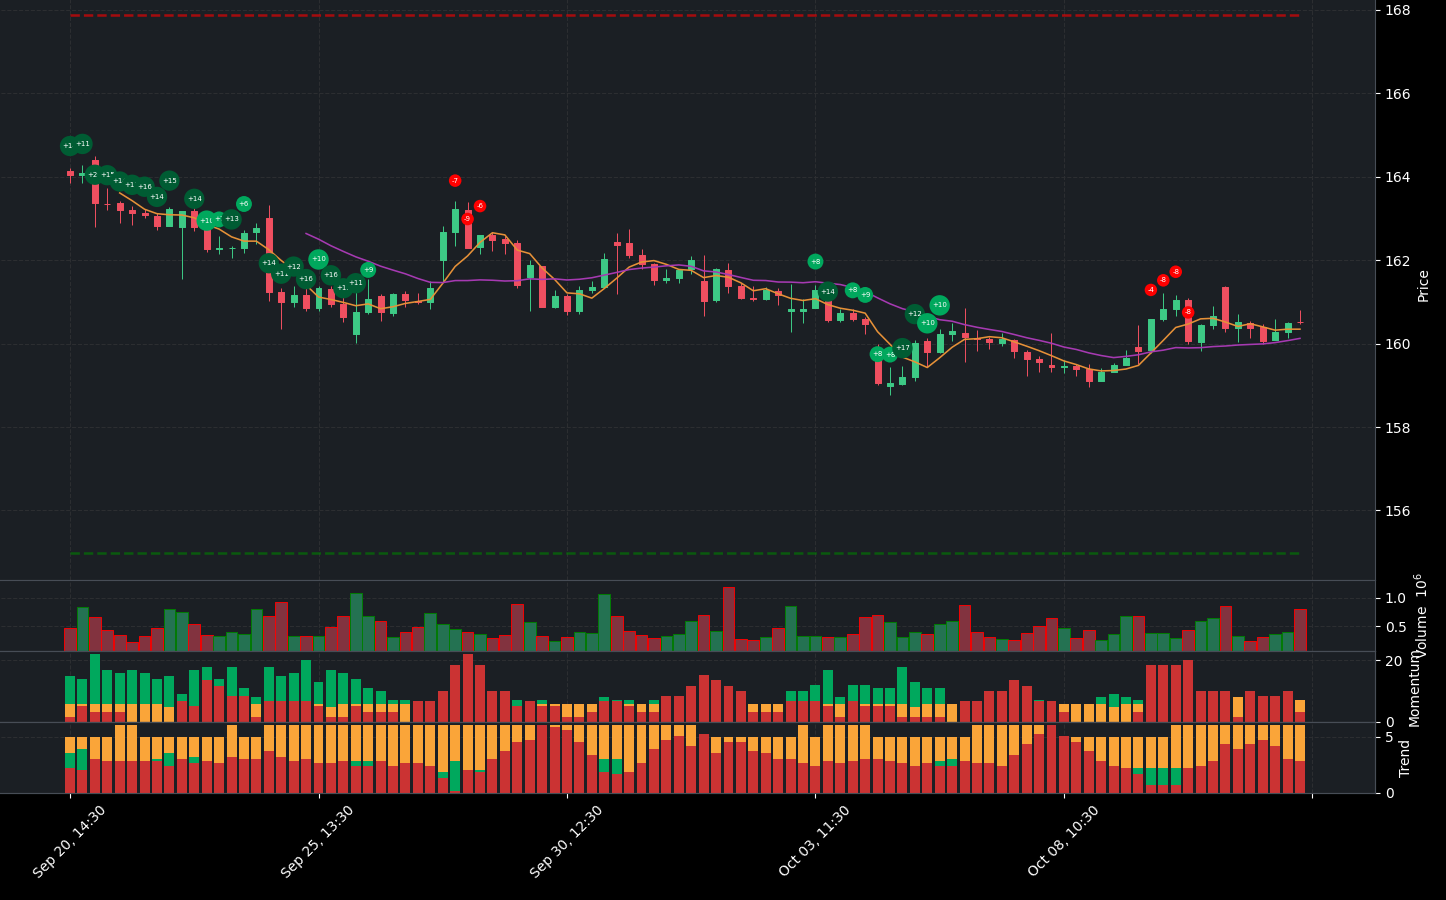
Johnson & Johnson (JNJ) presents a complex financial picture, characterized by both positive and negative indicators. On the positive side, the stock is currently experiencing a confirmed buy signal from the WaveTrend indicator, suggesting potential upward momentum. Additionally, the price is above the 50-day EMA, indicating a bullish trend that is strengthening. The On-Balance Volume (OBV) is also increasing, supported by high volume, which typically signals strong buying interest. Furthermore, the price is above the Supertrend line, reinforcing the bullish sentiment.
However, caution is warranted due to several negative indicators. The stock is currently below the 200-day EMA, which indicates a bearish trend that is also strengthening. The MACD has shown a negative histogram crossover, suggesting potential weakening momentum. While the price is above the middle band of its trading range, it is also approaching the upper band, which could indicate overbought conditions.
In summary, while JNJ shows signs of a bullish trend with positive momentum indicators, the underlying bearish signals from the longer-term moving averages and MACD suggest that investors should proceed with caution. A hold recommendation may be prudent, as the stock navigates through mixed signals and potential overbought conditions. Investors should closely monitor upcoming performance and market conditions to reassess their positions.
JNJ Fundamental Analysis
JNJ’s recent financial performance presents a compelling case for investment. The company demonstrates strong profitability, highlighted by a net income of $4.69 billion for the most recent period, indicating robust earnings potential. Furthermore, the year-over-year increase in net income is a positive indicator for future performance. The operating margin stands at an impressive 100.00%, showcasing exceptional operational efficiency and effective cost control. Additionally, a net profit margin of 20.88% reflects JNJ’s strong capability to generate profits after accounting for all expenses.
However, there are some areas that warrant caution. The average net debt of $13.37 billion raises questions about the company’s financial flexibility, and the low cash to total assets ratio of 0.13 suggests potential vulnerability to economic shocks.
In terms of valuation, JNJ’s forward P/E ratio of 15.27 indicates that the stock is reasonably valued relative to its earnings potential. Conversely, the price-to-sales ratio of 4.46 may suggest that the stock is somewhat overvalued in relation to its revenue generation. Additionally, while revenue growth of 4.30% is a positive sign, the earnings growth of -1.60% indicates some challenges ahead.
On the growth and profitability front, JNJ has shown a revenue growth of 4.98% year-over-year, which is a positive sign for the stock price. The company also boasts high profit margins of 43.91%, demonstrating its efficiency in generating profits. Moreover, a positive free cash flow of $19.14 billion indicates that JNJ has ample cash available for investments, debt reduction, or dividends.
From a shareholder perspective, the average ordinary shares outstanding is 2.45 billion, suggesting a stable shareholder base. The average treasury shares of 636.35 million indicate management’s confidence in the company’s future prospects through share buybacks.
Examining the income statement, JNJ reported total revenue of $22.45 billion, reflecting strong sales performance. The operating margin remains at 100.00%, and the net profit margin of 20.88% further underscores the company’s profitability.
On the balance sheet, the debt-to-equity ratio of -5.67 suggests a moderate level of leverage, which may be sustainable depending on the company’s industry and profitability. The current ratio of 1.47 indicates a healthy liquidity position, allowing the company to comfortably cover its short-term liabilities. However, the negative average tangible book value of -6.35 billion raises potential concerns regarding the company’s net worth.
In terms of cash flow, JNJ’s average capital expenditures of $4.01 billion indicate ongoing investments in growth and expansion. The positive net cash from financing of $22.67 billion suggests that the company is raising capital, which could be utilized for growth or debt reduction. Additionally, stock repurchases amounting to $4.44 billion can be seen as a positive signal, as they reduce the number of shares outstanding and may enhance earnings per share (EPS).
Overall, JNJ exhibits strong profitability and operational efficiency, alongside moderate revenue growth and a healthy liquidity position. However, investors should remain vigilant regarding the company’s debt levels and negative tangible book value. Despite these concerns, the stock is recommended as a buy due to its strong financial health and growth potential.
Financial Health
🟢 Net Income for the most recent period was $4.69 billion, indicating strong profitability.
🟢 Year-over-year net income increased, which is a positive sign for future performance.
🟢 Operating margin was 100.00%, suggesting exceptional operational efficiency and cost control.
🟢 Net profit margin of 20.88% reflects the company’s strong ability to generate profits after all expenses.
🔴 Average Net Debt is $13.37 billion, which requires further investigation regarding its impact on financial flexibility.
🔴 Cash to Total Assets Ratio is low at 0.13, indicating limited financial flexibility and potential vulnerability to economic shocks.
Valuation
🟢 Forward P/E ratio of 15.27 suggests the stock is reasonably valued relative to its earnings potential.
🔴 Price-to-Sales Ratio of 4.46 may indicate the stock is somewhat overvalued compared to its revenue generation.
🔴 Earnings Growth of -1.60% suggests some challenges in growth, but revenue growth of 4.30% is a positive indicator.
Growth and Profitability
🟢 Revenue growth of 4.98% year-over-year indicates moderate growth, which is a positive sign for the stock price.
🟢 High profit margins (43.91%) demonstrate the company’s ability to generate profits efficiently.
🟢 Positive free cash flow of $19.14 billion indicates the company has cash available for investments, debt reduction, or dividends.
Shareholder Information
🟢 Average Ordinary Shares Outstanding is 2.45 billion, indicating a stable shareholder base.
🟢 Average Treasury Shares of 636.35 million suggest management’s confidence in the company’s future prospects through share buybacks.
Income Statement
🟢 Total revenue for the most recent period was $22.45 billion, showing strong sales performance.
🟢 Operating margin of 100.00% suggests efficient operations.
🟢 Net profit margin of 20.88% reflects the company’s ability to generate profits after expenses.
Balance Sheet
🔴 Debt-to-Equity Ratio of -5.67 suggests a moderate level of leverage, which may be sustainable depending on the company’s industry and profitability.
🟢 Current Ratio of 1.47 indicates a healthy liquidity position, suggesting the company can cover its short-term liabilities comfortably.
🔴 Average Tangible Book Value is negative at -$6.35 billion, indicating potential concerns regarding the company’s net worth.
Cashflow
🟢 Average Capital Expenditures of $4.01 billion suggest the company is investing in growth and expansion.
🟢 Positive net cash from financing of $22.67 billion indicates the company is raising capital, which could be used for growth or debt reduction.
🟢 Stock repurchases of $4.44 billion can be a positive signal as it reduces the number of shares outstanding and may boost earnings per share (EPS).
Overall, the company shows strong profitability and operational efficiency, with moderate revenue growth and a healthy liquidity position. However, attention should be paid to the debt levels and the negative tangible book value. Overall, the stock is recommended as a buy due to its strong financial health and growth potential.
JNJ News Analysis
Johnson & Johnson (JNJ) faces a mixed outlook with ongoing legal challenges and upcoming earnings that could impact investor sentiment.
Summary of JNJ news indicates a blend of challenges and opportunities for investors. The ongoing insolvency case and bankruptcy issues present risks, while the company’s participation in healthcare conferences and acquisition activities suggest potential growth avenues. Investors should weigh these factors carefully.
🔴 Johnson & Johnson’s unit can retain an insolvency case in Texas, which may lead to prolonged legal battles and uncertainty regarding financial liabilities.
🔴 The bankruptcy stay in Texas despite opposition indicates that JNJ is still grappling with significant legal challenges related to its talc products, which could affect its reputation and financial standing.
🟢 On a more positive note, JNJ is preparing for its upcoming earnings report, which could provide insights into its financial health and operational performance.
🟢 The company is also participating in the Stifel 2024 Healthcare Conference, which may enhance its visibility and investor relations.
🟢 JNJ’s acquisition of heart failure treatment company V-Wave suggests a strategic move to expand its portfolio and address critical healthcare needs, potentially driving future growth.
🔴 However, the stock has shown minimal movement recently, indicating investor caution amidst these developments.
JNJ Holders Analysis
The financial health of JNJ presents a mixed outlook for the next month. While there are positive indicators, there are also concerns that warrant a cautious approach.
🟢 JNJ has a **high institutional ownership** at 72.68%, indicating strong interest from large investors. This suggests a level of confidence in the company’s long-term prospects.
🟡 The **very low insider ownership** at 0.09% raises questions about management’s confidence in the company’s future. This could imply a lack of alignment between management and shareholder interests.
🟢 The number of institutional holders is substantial at **4717**, which indicates a diversified ownership structure and widespread institutional interest. This can provide stability to the stock price.
🔴 Recent insider transactions show a **higher number of sales** compared to purchases, which may indicate a lack of confidence among insiders regarding the stock’s near-term performance.
🟡 The overall sentiment from analysts appears to be neutral, with no strong buy or sell recommendations dominating the landscape. This reflects uncertainty in the market regarding JNJ’s future performance.
JNJ Analyst Ratings
The analyst ratings for JNJ show a balanced outlook, with a total of 4 strong buy ratings, 8 buy ratings, 8 hold ratings, 2 sell ratings, and 1 strong sell rating. This indicates a generally positive sentiment among analysts, although there is a notable number of hold ratings which suggests some caution. 🟡
In the past month, the consistency of the ratings, particularly the upgrades from Cantor Fitzgerald and RBC Capital, reinforces the positive outlook. However, the presence of 8 hold ratings indicates that some analysts are cautious about the stock’s near-term performance.
🟢 Given the overall positive sentiment and recent upgrades, it is likely that JNJ will see moderate growth in the next month. A forecasted price increase of around 3-5% is reasonable based on historical performance and current analyst sentiment. However, the medium confidence level suggests that investors should remain vigilant for any market changes that could impact the stock’s performance.
JNJ Economic Analysis
Based on the US economic and market data:
🟢 The **unemployment rate** has increased slightly to 4.3%, but it remains relatively low, indicating a stable labor market that supports consumer spending. This is beneficial for JNJ as it operates in the healthcare sector, which is less sensitive to economic downturns.
🟡 **Retail sales** have shown an increase, with the latest figure at 627,510.0, suggesting that consumer demand is holding up, which can positively impact JNJ’s sales of consumer health products.
🔴 The **CPI** remains high at 314.540, indicating persistent inflationary pressures. This could lead to increased costs for JNJ, affecting profit margins if they cannot pass these costs onto consumers.
🟢 The **GDP growth** is stable, with the latest figure at 5737.189, suggesting that the economy is not in recession, which is favorable for JNJ’s overall business environment.
🔴 The **monthly treasury yield** has increased to 4.25%, which could lead to higher borrowing costs for companies, including JNJ, potentially impacting their capital expenditures.
Overall, while there are some inflationary pressures and rising yields that could pose challenges, the stable labor market and consumer demand provide a supportive backdrop for JNJ’s performance in the coming month. The stock is currently trading at 160.51, with a target mean price of 172.74, indicating potential upside.
In summary, the mixed signals from the economic data suggest a cautious but optimistic outlook for JNJ, warranting a “Buy” recommendation.
Disclaimer
Investors may consider the AI predictions and news summaries as one factor in their investment decisions alongside their own research and risk tolerance.


