
JPMorgan Chase & Co. (JPM) Stock Analysis: A Mixed Outlook Ahead!
🔴 Recommendation: JPM is currently presenting a complex financial picture with both bullish and cautionary signals, suggesting a hold strategy may be prudent for investors.
📈 Key Highlights:
Financial Health: Strong net income of $18.15 billion and a healthy current ratio of 4.45 indicate robust profitability and liquidity.
Valuation: A forward P/E ratio of 12.55 suggests potential undervaluation, making JPM an attractive buy at current levels.
Growth: Impressive revenue growth of 19.45% year-over-year reflects increasing demand for services and strong business performance.
⚠️ Caution Flags:
Debt Concerns: A debt-to-equity ratio of 1.81 raises financial risk concerns, indicating a higher reliance on debt financing.
Mixed Momentum Indicators: Recent sell signals from the WaveTrend and MACD indicators suggest potential shifts in momentum that warrant caution.
As we delve deeper into the analysis, we’ll explore the price trends, key indicators, financial health, valuation metrics, and more to provide a comprehensive view of JPM’s current standing and future prospects. Let’s dive into the details! 👇
JPM Price Analysis
| Positive Momentum Signals | Negative Momentum Signals | Hold Momentum Signals |
|---|---|---|
|
|
| Positive Trend Signals | Negative Trend Signals | Hold Trend Signals |
|---|---|---|
|
|
|
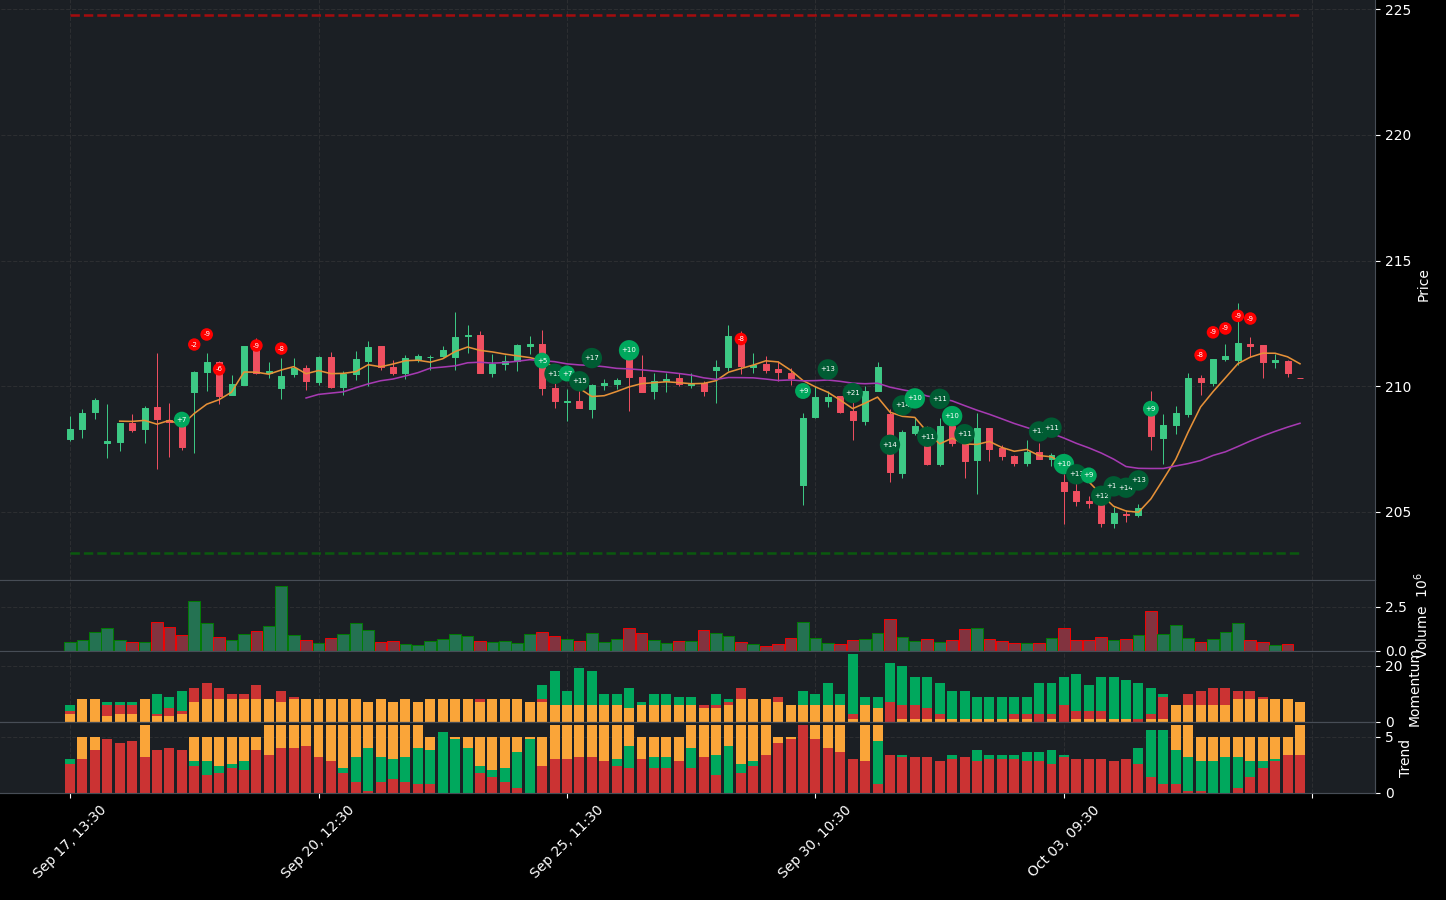
JPMorgan Chase & Co. (JPM) presents a complex financial picture, characterized by both strengths and weaknesses. Currently, the stock is trading at a neutral price level, indicating a lack of clear direction in the short term.
On the positive side, several trend indicators suggest a bullish outlook. The price is notably above the 50-day and 200-day Exponential Moving Averages (EMAs), which typically signals a strengthening bullish trend. Additionally, the price is positioned above the middle band of the Bollinger Bands, indicating an uptrend, although investors should be cautious of potential overbought conditions. The Supertrend indicator also confirms a bullish trend, as the price remains above the Supertrend line.
However, there are significant cautionary signals as well. The WaveTrend indicator has issued a sell signal with a confirmed crossover, suggesting that momentum may be shifting negatively. Furthermore, the MACD has shown a negative histogram crossover, which could indicate weakening momentum. These negative momentum indicators raise concerns about the sustainability of the current bullish trend.
In summary, while JPMorgan Chase exhibits several bullish characteristics, including strong positioning above key moving averages and a positive Supertrend, the presence of negative momentum indicators suggests that investors should exercise caution. The mixed signals imply that a hold strategy may be prudent until clearer trends emerge, particularly given the recent sell signals that could indicate a potential reversal in momentum.
JPM Fundamental Analysis
JPMorgan Chase (JPM) demonstrates a robust financial performance, earning a Strong Buy recommendation based on its fundamental analysis.
In terms of financial health, JPM’s net income for the most recent period stands at an impressive $18.15 billion, showcasing strong profitability. The year-over-year increase in net income is a positive indicator for future performance. The company’s current ratio of 4.45 reflects a healthy liquidity position, suggesting that it can comfortably cover its short-term liabilities. However, the debt-to-equity ratio of 1.81 raises concerns about financial risk, indicating a higher reliance on debt financing. Additionally, the cash to total assets ratio of 0.14 suggests limited financial flexibility, which could pose challenges during economic downturns.
When examining valuation, JPM’s forward P/E ratio of 12.55 indicates potential undervaluation, suggesting that the stock may be a good buy at current levels. The price-to-sales ratio of 3.72 is reasonable, reflecting a fair valuation relative to revenue.
In terms of growth and profitability, JPM shows strong revenue growth of 19.45% year-over-year, indicating robust growth potential and increasing demand for its services. Earnings growth of 28.80% reflects exceptional business performance and profitability. The operating margin of 100.00% suggests outstanding operational efficiency, while the net profit margin of 36.26% demonstrates the company’s ability to generate profits after all expenses.
Regarding shareholder information, JPM has engaged in stock repurchases totaling $12.34 billion, indicating management’s confidence in the company’s future prospects and enhancing shareholder value. The average ordinary shares outstanding at 2.88 billion suggest stability in share count, although fluctuations could impact stock price.
In the income statement, total revenue for the most recent period was $50.06 billion, indicating strong sales performance. The net interest income of $22.75 billion is a positive sign, reflecting income generated from interest-bearing assets. However, the significant interest expense of $25.77 billion could impact net income if not managed effectively.
On the balance sheet, the average total debt of $426.68 billion requires further analysis to understand its composition and terms, as it may impact financial health. The average tangible book value of $235.30 billion indicates a solid net worth, but trends over time should be monitored. The average treasury shares of 1.23 billion suggest active share buyback activity, which can be a positive signal for investors.
In terms of cash flow, net cash from financing of $146.34 billion indicates positive cash flow from capital-raising activities, which could be utilized for growth or debt reduction. The stock repurchases of $12.34 billion can enhance earnings per share and reflect management’s confidence in the company’s future.
Overall, JPMorgan Chase exhibits strong financial performance, healthy growth metrics, and positive shareholder actions, warranting a strong buy recommendation. Investors should consider the company’s solid fundamentals and growth potential when evaluating their investment decisions.
Financial Health
🟢 Net Income for the most recent period was $18.15 billion, indicating strong profitability.
🟢 Year-over-year net income increased, which is a positive sign for future performance.
🟢 Current Ratio of 4.45 indicates a healthy liquidity position, suggesting the company can comfortably cover its short-term liabilities.
🔴 Debt-to-Equity Ratio of 1.81 raises concerns about financial risk, indicating a higher reliance on debt financing.
🟡 Cash to Total Assets Ratio of 0.14 suggests limited financial flexibility, which could be a concern during economic downturns.
Valuation
🟢 Forward P/E ratio of 12.55 suggests potential undervaluation, indicating that the stock may be a good buy at current levels.
🟢 Price-to-Sales Ratio of 3.72 is reasonable, reflecting a fair valuation relative to revenue.
Growth and Profitability
🟢 Revenue Growth of 19.45% year-over-year indicates strong growth potential and increasing demand for services.
🟢 Earnings Growth of 28.80% reflects robust business performance and profitability.
🟢 Operating Margin of 100.00% suggests exceptional operational efficiency.
🟢 Net Profit Margin of 36.26% demonstrates the company’s ability to generate profits after all expenses.
Shareholder Information
🟢 Stock Repurchases of $12.34 billion indicate management’s confidence in the company’s future prospects and can enhance shareholder value.
🟡 Average Ordinary Shares Outstanding at 2.88 billion suggests stability in share count, but fluctuations could impact stock price.
Income Statement
🟢 Total Revenue for the most recent period was $50.06 billion, indicating strong sales performance.
🟢 Net Interest Income of $22.75 billion is a positive sign, reflecting income generated from interest-bearing assets.
🔴 Interest Expense of $25.77 billion is significant and could impact net income if not managed effectively.
Balance Sheet
🔴 Average Total Debt of $426.68 billion requires further analysis to understand its composition and terms, as it may impact financial health.
🟡 Average Tangible Book Value of $235.30 billion indicates a solid net worth, but trends over time should be monitored.
🟢 Average Treasury Shares of 1.23 billion suggest active share buyback activity, which can be a positive signal for investors.
Cashflow
🟢 Net Cash from Financing of $146.34 billion indicates positive cash flow from capital raising activities, which could be used for growth or debt reduction.
🟢 Stock Repurchases of $12.34 billion can enhance earnings per share and reflect management’s confidence in the company’s future.
Overall, JPMorgan Chase shows strong financial performance, healthy growth metrics, and positive shareholder actions, warranting a strong buy recommendation.
JPM News Analysis
JPMorgan Chase & Co. (JPM) is positioned positively with several developments indicating potential growth, although some caution is warranted due to market conditions.
Summary of JPM news indicates a generally positive outlook for JPMorgan Chase & Co. (JPM). The company is involved in significant market activities, including potential spin-offs and bullish sentiment from hedge funds. However, the upcoming earnings season may introduce volatility. Investors should weigh these factors carefully.
🟢 JPMorgan has been tapped alongside Goldman Sachs to assist in spinning off Continental Car Parts, indicating strong market positioning and potential for increased revenue streams.
🟢 Hedge funds are showing bullish sentiment towards JPM, suggesting confidence in the stock’s performance and potential for upward movement.
🟢 The upcoming Q3 earnings season is generating interest, with expectations that JPM will perform well, which could positively influence stock prices.
🔴 Despite the positive indicators, the market’s overall volatility and economic conditions may pose risks, necessitating a cautious approach.
🟢 Analysts are considering JPM as one of the most undervalued large-cap stocks, which could attract more investors looking for growth opportunities.
JPM Holders Analysis
The financial landscape for JPMorgan Chase (JPM) presents a mixed outlook for the next month. While there are positive indicators, certain factors warrant a cautious approach.
🟢 **High institutional ownership** at 73.71% indicates strong interest from large investors, suggesting confidence in the company’s stability and growth potential. This level of institutional backing typically provides a buffer against volatility.
🟡 **Insider ownership is very low** at 0.45%, which may reflect a lack of confidence from management or a high degree of external control. This could be a concern for potential investors as it may indicate that insiders do not have significant skin in the game.
🟢 The number of institutional holders is substantial at 5068, indicating a diversified ownership structure. This broad base can help stabilize the stock price against sudden sell-offs by any single investor.
🔴 Recent insider transactions show a **higher number of sales compared to purchases**, which could signal a lack of confidence among insiders regarding the stock’s short-term performance. This trend may raise red flags for potential investors.
🟡 The stock has shown resilience in the face of market fluctuations, but the mixed signals from insider transactions and the low insider ownership suggest that investors should proceed with caution.
JPM Analyst Ratings
The analyst ratings for JPM have shown a mixed sentiment, with a notable number of hold ratings alongside several buy and strong buy recommendations. The recent upgrades from firms like Oppenheimer and Morgan Stanley indicate a positive outlook, while the downgrade from Deutsche Bank suggests some caution.
🟡 In the past month, there have been 4 strong buy ratings, 9 buy ratings, 13 hold ratings, 1 sell rating, and 1 strong sell rating. This indicates a generally positive sentiment, but the significant number of hold ratings reflects some uncertainty among analysts.
🟢 Given the recent analyst upgrades and the overall positive sentiment, it is likely that the stock will perform moderately well in the next month. However, the medium confidence level suggests that investors should remain cautious and monitor market conditions closely. A price target of around $150 could be reasonable based on current trends and analyst expectations.
JPM Economic Analysis
Based on the US economic and market data:
🔴 The unemployment rate has increased to 4.3%, up from 4.1% in the previous month, indicating potential weakness in the labor market which could lead to reduced consumer spending and negatively impact JPM’s revenue from its Consumer & Community Banking segment.
🟡 Retail sales have shown a slight increase, but the overall growth is modest, suggesting that consumer demand is not robust enough to significantly boost JPM’s earnings in the short term.
🟢 The GDP growth rate remains stable, which is a positive sign for the overall economy and could support JPM’s performance in the long run.
🔴 The recent increase in Treasury yields could lead to higher borrowing costs, which may negatively impact loan demand and profitability for JPM.
🟢 Despite these challenges, JPM has a strong market position and diversified revenue streams, which may help mitigate some of the negative impacts from the economic data.
In the next month, I expect JPM’s stock price to remain relatively stable, with potential fluctuations between $205 and $215, as the market digests the mixed economic signals. The current price of $210.335 suggests that investors are cautious but still see value in JPM’s diversified business model.
Disclaimer
Investors may consider the AI predictions and news summaries as one factor in their investment decisions alongside their own research and risk tolerance.


