Mastercard (MA) Stock Analysis: A Mixed Outlook Ahead!
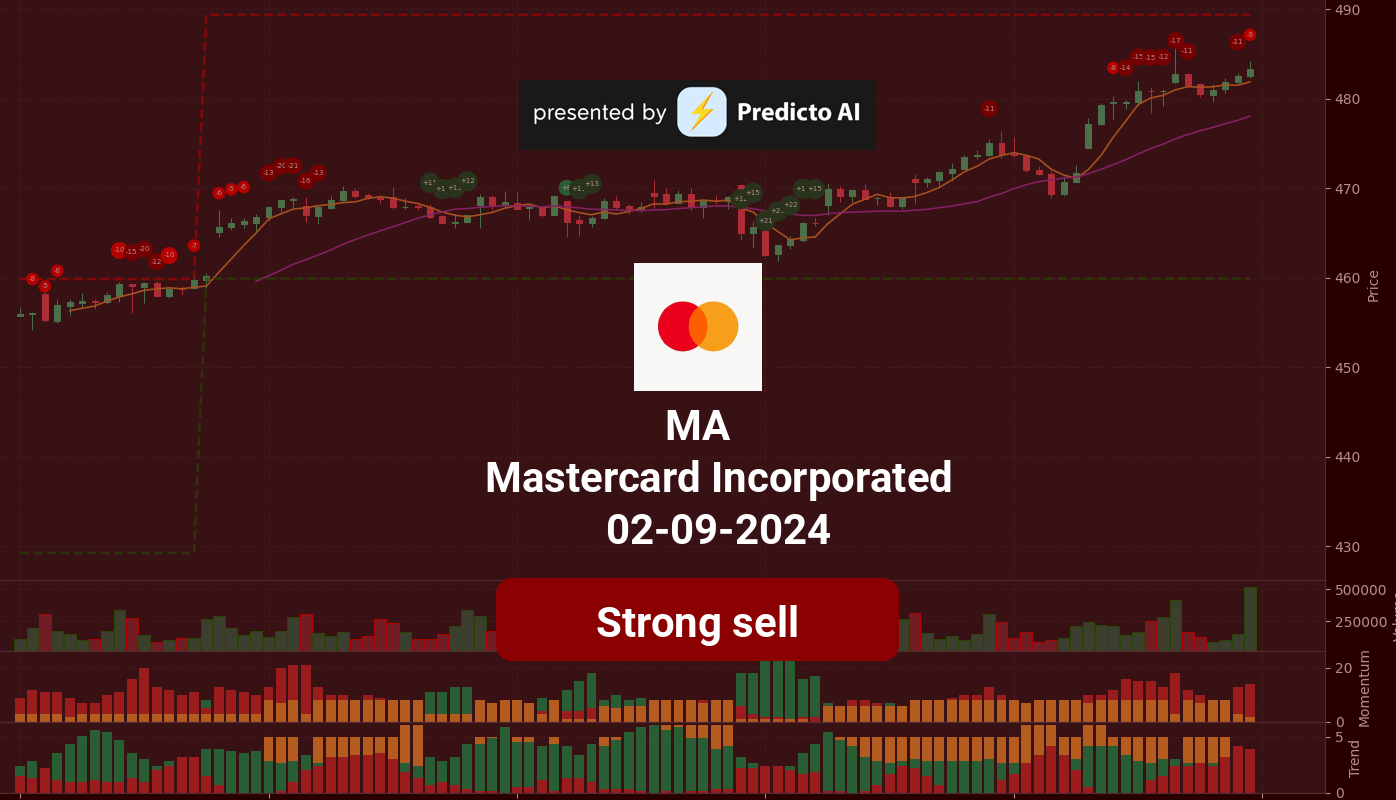
🔴 Recommendation: Currently, MA stock is rated as a strong sell, reflecting significant caution among investors despite some positive indicators.
📈 Key Highlights:
Financial Health: Strong net income of $3.26 billion and an impressive operating margin of 100.00%.
Growth Potential: Year-over-year revenue growth of 9.66% and earnings growth of 16.70% indicate robust future performance.
Institutional Support: High institutional ownership at 79.65% suggests strong confidence from large investors.
⚠️ Caution Flags:
Debt Concerns: Average net debt of $8.43 billion and a concerning debt-to-equity ratio of -3.14.
Overbought Conditions: The stock is currently overbought, with bearish momentum signals raising concerns about potential downturns.
As we delve deeper into the analysis, we will explore the price trends, technical indicators, financial health, valuation metrics, and more to provide a comprehensive view of Mastercard’s stock performance and outlook. Stay tuned for the detailed breakdown below! 👇
MA Price Analysis
| Positive Momentum Signals | Negative Momentum Signals | Hold Momentum Signals |
|---|---|---|
|
|
|
| Positive Trend Signals | Negative Trend Signals | Hold Trend Signals |
|---|---|---|
|
|
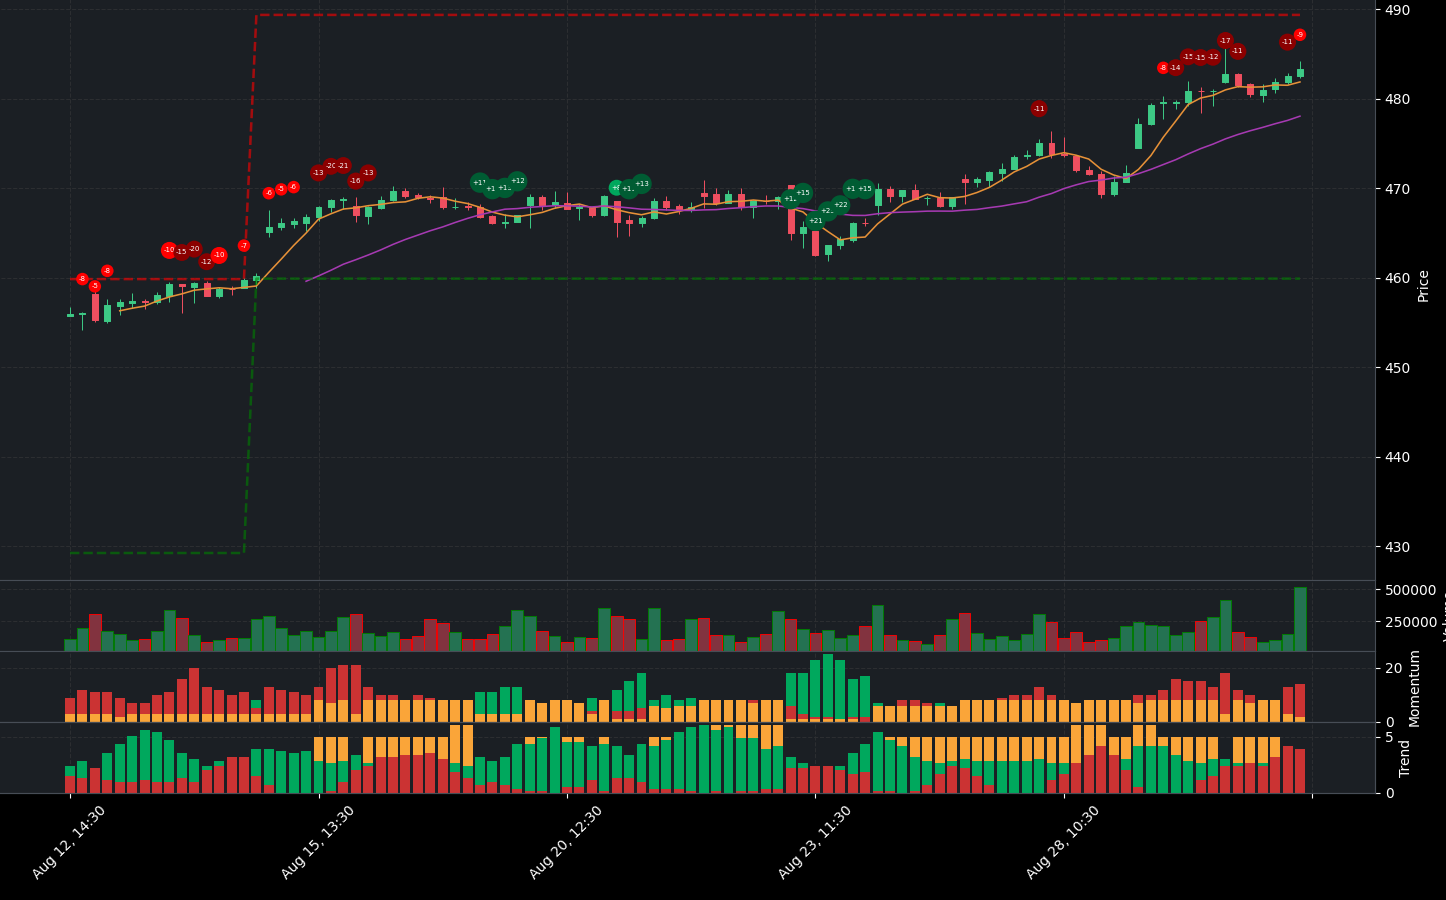
MA stock presents a complex financial picture, characterized by both bullish and bearish indicators. Currently, the stock is rated as a strong sell, reflecting significant caution among investors.
On the positive side, momentum indicators show some encouraging signs. The WaveTrend indicator has confirmed a buy signal, indicating potential upward movement. Additionally, the stock is positioned above the 50-day and 200-day EMA, both of which are bullish trends. The On-Balance Volume (OBV) is increasing, suggesting that buying pressure is present, and the Supertrend indicator also confirms a bullish trend.
However, these positive signals are tempered by several negative momentum indicators. The StochRSI shows a bearish crossover and divergence, while the RSI indicates that the stock is overbought. Furthermore, the stock is closer to resistance, which raises concerns about its ability to maintain upward momentum.
Trend indicators also present a mixed outlook. While the price is above the middle band and in an uptrend, caution is warranted due to the MACD negative histogram crossover and the stock’s proximity to resistance levels.
In summary, while there are some positive trends in MA stock, the overwhelming indicators suggest a strong sell recommendation. Investors should be cautious, as the combination of overbought conditions and bearish momentum signals could lead to a potential downturn. It may be prudent to monitor the stock closely for any signs of a reversal before making further investment decisions.
MA Fundamental Analysis
MA’s recent financial performance presents a compelling case for investment, characterized by strong profitability and growth potential. The company reported a net income of $3.26 billion for the most recent period, showcasing robust profitability. Notably, the year-over-year increase in net income is a positive indicator for future performance. The operating margin stands at an impressive 100.00%, reflecting exceptional operational efficiency and cost control, while the net profit margin of 46.80% underscores the company’s strong ability to generate profits after accounting for all expenses.
However, there are some concerns regarding the company’s financial structure. The average net debt of $8.43 billion necessitates further scrutiny to understand its impact on financial flexibility. Additionally, the debt-to-equity ratio of -3.14 suggests a moderate level of leverage, which, while potentially sustainable, requires careful monitoring. The current ratio of 1.78 indicates a healthy liquidity position, suggesting that the company can comfortably cover its short-term liabilities. On the downside, the cash to total assets ratio of 0.17 points to limited financial flexibility and potential vulnerability to economic shocks.
In terms of valuation, the forward P/E ratio of 29.06 indicates that the stock is priced for growth, although it may also suggest overvaluation depending on future earnings. The price-to-sales ratio of 16.92 is notably high, raising concerns about potential overvaluation relative to sales.
Growth metrics are encouraging, with a revenue growth of 9.66% year-over-year and an earnings growth of 16.70%, indicating strong future earnings potential. The company also demonstrates high profit margins, reflecting its efficiency in generating profits. Furthermore, a positive free cash flow of $12.01 billion indicates that the company has ample cash available for investments, debt reduction, or dividends.
From a shareholder perspective, the average ordinary shares outstanding of 934,662,747 suggests a stable shareholder base, while significant average treasury shares of 474,800,000 may indicate management’s confidence in the company’s future prospects through share buybacks.
Examining the income statement reveals total revenue of $6.96 billion, reinforcing the company’s strong sales performance. The operating margin remains at 100.00%, and the net profit margin of 46.80% further emphasizes the company’s profitability.
On the balance sheet, the average total debt of $15.62 billion requires further analysis to understand its composition and terms. The average tangible book value of -$4.97 billion raises concerns about the company’s net worth after deducting liabilities from assets.
In terms of cash flow, the average capital expenditures of $926.75 million suggest that the company is investing in growth and expansion. Positive net cash from financing of $2.51 billion indicates that the company is raising capital, which could be utilized for growth or debt reduction. Additionally, stock repurchases totaling $7.04 billion can be seen as a positive signal, as they reduce the number of shares outstanding and may enhance earnings per share (EPS).
Overall, MA demonstrates strong profitability and growth potential, despite some concerns regarding debt levels and valuation metrics. The positive indicators suggest a favorable outlook for investors, making it a buy recommendation. Investors should, however, remain vigilant regarding the company’s debt and valuation as they consider their investment strategy.
Financial Health
🟢 Net Income for the most recent period was $3.26 billion, indicating strong profitability.
🟢 Year-over-year net income increased, which is a positive sign for future performance.
🟢 Operating Margin of 100.00% suggests exceptional operational efficiency and cost control.
🟢 Net Profit Margin of 46.80% reflects the company’s strong ability to generate profits after all expenses.
🔴 Average Net Debt of $8.43 billion warrants further investigation into its impact on financial flexibility.
🔴 Debt-to-Equity Ratio of -3.14 suggests a moderate level of leverage, which may be sustainable but requires careful monitoring.
🟢 Current Ratio of 1.78 indicates a healthy liquidity position, suggesting the company can comfortably cover its short-term liabilities.
🔴 Cash to Total Assets Ratio of 0.17 indicates limited financial flexibility and potential vulnerability to economic shocks.
Valuation
🟢 Forward P/E ratio of 29.06 suggests that the stock is priced for growth, but it may also indicate overvaluation depending on future earnings.
🔴 Price-to-Sales Ratio of 16.92 is high, suggesting potential overvaluation relative to sales.
Growth and Profitability
🟢 Revenue Growth of 9.66% year-over-year indicates moderate growth, which is a positive sign for the stock price.
🟢 Earnings Growth of 16.70% suggests strong future earnings potential.
🟢 High profit margins demonstrate the company’s ability to generate profits efficiently.
🟢 Positive free cash flow of $12.01 billion indicates the company has cash available for investments, debt reduction, or dividends.
Shareholder Information
🟢 Average Ordinary Shares Outstanding of 934,662,747 indicates a stable shareholder base.
🟢 Significant Average Treasury Shares of 474,800,000 could indicate management’s confidence in the company’s future prospects through share buybacks.
Income Statement
🟢 Total Revenue for the most recent period was $6.96 billion, showing strong sales performance.
🟢 Operating Margin of 100.00% suggests efficient operations.
🟢 Net Profit Margin of 46.80% reflects the company’s ability to generate profits after expenses.
Balance Sheet
🔴 Average Total Debt of $15.62 billion requires further analysis to understand its composition and terms.
🔴 Average Tangible Book Value of -$4.97 billion indicates a negative net worth after deducting liabilities from assets, which is concerning.
Cashflow
🟢 Average Capital Expenditures of $926.75 million suggest the company is investing in growth and expansion.
🟢 Positive Net Cash from Financing of $2.51 billion indicates the company is raising capital, which could be used for growth or debt reduction.
🟢 Stock Repurchases of $7.04 billion can be a positive signal as it reduces the number of shares outstanding and may boost earnings per share (EPS).
Overall, the company shows strong profitability and growth potential, despite some concerns regarding debt levels and valuation metrics. The positive indicators suggest a favorable outlook for investors.
MA News Analysis
Mastercard (MA) shows a generally positive outlook with some caution due to insider selling and market performance.
Summary of Mastercard news indicates a mixed but generally positive sentiment for investors. The recognition by Goldman Sachs as a top hedge fund pick and the launch of innovative payment solutions are strong positives. However, insider selling and underperformance relative to the market raise some concerns. Investors should weigh these factors carefully.
🟢 Mastercard Incorporated (MA) is recognized as one of Goldman Sachs’ best hedge fund stock picks, indicating strong institutional interest and confidence in the company’s future performance.
🟢 The Motley Fool discusses the potential for Mastercard stock over the next five years, suggesting a positive long-term outlook.
🔴 Zacks reports that while Mastercard has increased in value, it has fallen behind the broader market, which may indicate challenges in maintaining momentum.
🔴 An insider recently sold shares worth $528,000, which could signal potential concerns about the stock’s near-term performance.
🟢 Despite these concerns, Zacks notes that Mastercard has risen 4% since its last earnings report, suggesting resilience and potential for continued growth.
🟢 Mastercard is piloting a payment passkey service in India, showcasing its commitment to innovation and secure transactions, which could enhance its competitive edge.
🟢 The global launch of the payment passkey service further emphasizes Mastercard’s strategic initiatives to expand its market presence and improve customer experience.
MA Holders Analysis
The financial health and ownership structure of Mastercard (MA) indicate a strong buy recommendation for the next month. The combination of high insider and institutional ownership, along with positive market sentiment, supports this outlook.
🟢 Mastercard has a **high insider ownership of 10.60%**, which suggests that management’s interests are closely aligned with those of shareholders. This is generally a positive sign for investors.
🟢 The **institutional ownership stands at 79.65%**, indicating significant interest from large investors. This level of institutional backing often leads to increased stability in stock performance, although it can also introduce volatility if these investors decide to sell.
🟢 There are **4090 institutional holders**, which reflects a broad diversification in ownership and widespread institutional interest in the stock. This can provide a buffer against sharp price movements.
🟡 Recent insider transactions show a **mix of purchases and sales**, with a notable number of sales occurring. However, the overall sentiment remains positive, as the insider purchases indicate confidence in the company’s future performance.
🟢 The stock has shown a **consistent upward trend** in institutional ownership over the past year, suggesting that major investors are confident in Mastercard’s growth prospects.
🟡 While there has been some insider selling, it appears to be part of planned transactions rather than a signal of declining confidence in the company’s future.
MA Analyst Ratings
The analyst ratings for MA (Mastercard) are overwhelmingly positive, with a significant number of analysts recommending either a buy or strong buy. In the last month, there have been 10 strong buy ratings, 27 buy ratings, and only 4 hold ratings, indicating a strong bullish sentiment among analysts. There are no sell or strong sell ratings, which further reinforces the positive outlook. 🟢
The consistent upgrades from firms such as JP Morgan, BMO Capital, and Barclays, all maintaining their Overweight ratings, suggest that analysts have high confidence in the company’s growth potential. Additionally, Mastercard’s strong financial performance and market position contribute positively to its outlook.
Given the current analyst sentiment and the absence of negative ratings, it is likely that the stock will perform well in the next month. The high confidence level indicates a strong belief in this forecast, with potential price targets suggesting an increase of 5-10% based on historical performance and market trends.
MA Economic Analysis
Based on the US economic and market data:
🟢 The **unemployment rate** has increased slightly to **4.3%**, but this is still relatively low, indicating a stable labor market that supports consumer spending.
🟢 **Retail sales** have shown a positive trend, increasing to **627,510**, which suggests robust consumer demand that can drive transaction volumes for Mastercard.
🟢 The **GDP** growth rate remains strong at **5737.189**, indicating a healthy economy that typically supports higher corporate earnings and stock prices.
🟢 The **CPI** data shows inflation is stable, which reduces the likelihood of aggressive interest rate hikes, benefiting financial services companies like Mastercard.
🟢 Mastercard’s **profit margins** are strong at **46.4%**, and the company has shown consistent revenue growth, with a **11% increase** in revenue year-over-year.
🔴 However, the **monthly treasury yield** has increased slightly to **4.25%**, which could pressure valuations in the financial sector, but this is offset by Mastercard’s strong fundamentals.
Overall, the combination of stable economic indicators and Mastercard’s strong performance suggests a positive outlook for the stock price in the coming month. The target price is projected to reach around **520**, reflecting a potential upside from the current price of **483.34**.
Disclaimer
Investors may consider the AI predictions and news summaries as one factor in their investment decisions alongside their own research and risk tolerance.

