MA Stock Analysis: A Mixed Bag of Signals!
🔴 Recommendation: MA is currently rated as a Strong Sell, reflecting significant concerns despite some positive trends in its performance.
📈 Key Highlights:
Profitability: Strong net income of $3.26 billion, showcasing robust profitability.
Growth: Year-over-year revenue growth of 9.66% indicates moderate expansion potential.
Financial Health: Operating margin of 100.00% suggests exceptional operational efficiency.
⚠️ Caution Flags:
High Debt: Average net debt stands at $8.43 billion, raising concerns about financial flexibility.
Overvaluation: Price-to-sales ratio of 17.29 indicates potential overvaluation compared to revenue.
As we delve deeper into the analysis, we will explore the intricate price trends, various indicators, financial health metrics, valuation assessments, and more to provide a comprehensive overview of Mastercard’s current standing and future outlook. Stay tuned for the detailed breakdown! 👇
MA Price Analysis
| Positive Momentum Signals | Negative Momentum Signals | Hold Momentum Signals |
|---|---|---|
|
|
| Positive Trend Signals | Negative Trend Signals | Hold Trend Signals |
|---|---|---|
|
|
|
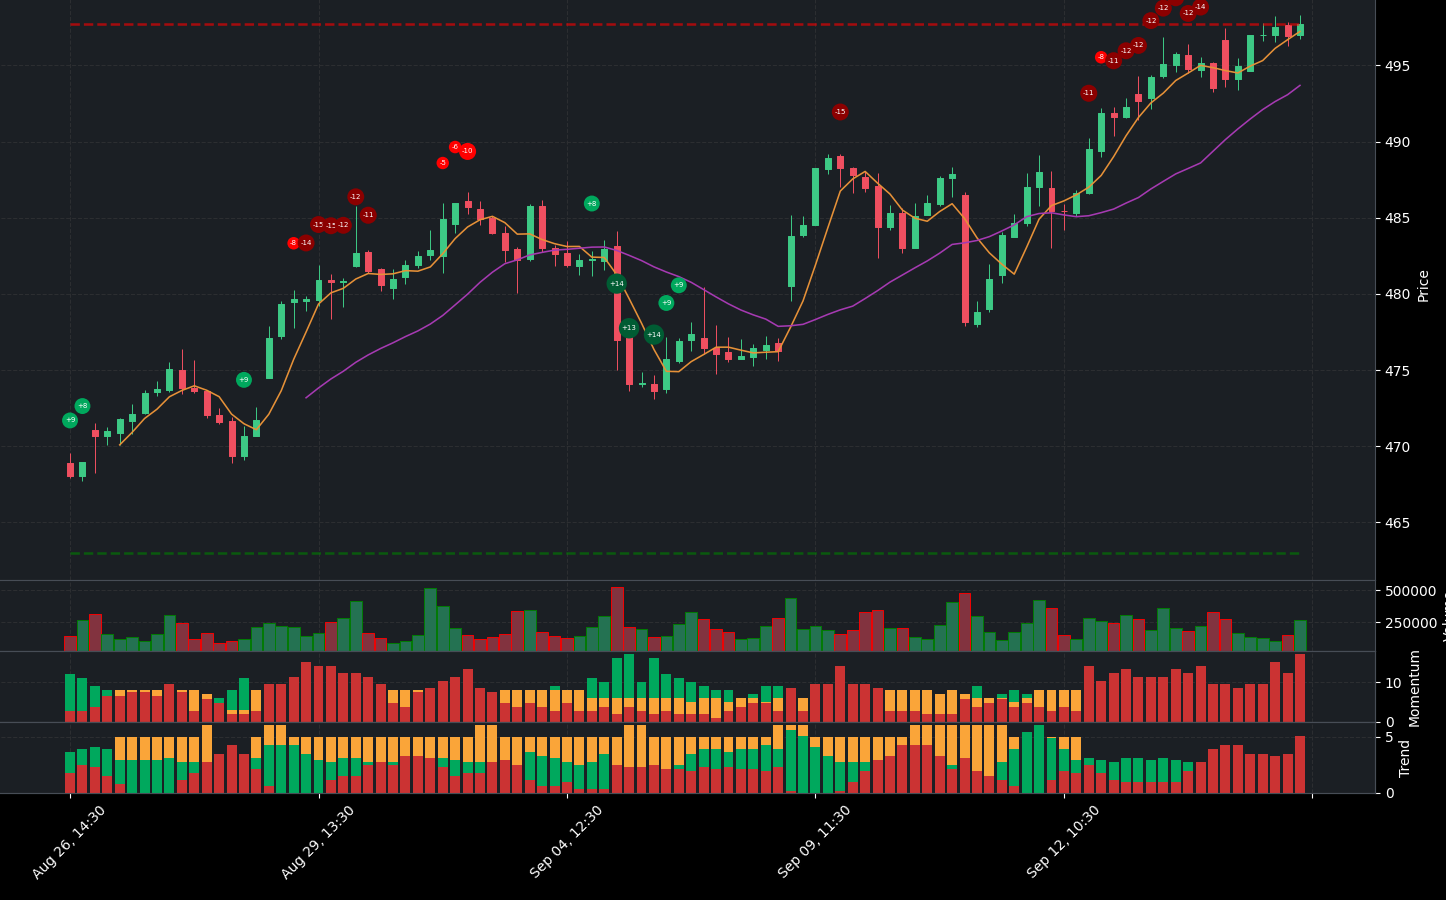
MA stock presents a complex financial picture, characterized by both bullish and bearish indicators. Currently, the stock is rated as a strong sell, reflecting significant concerns despite some positive trends.
On the positive side, MA’s price is above both the 50-day EMA and the 200-day EMA, indicating a bullish trend that is strengthening. Additionally, the On-Balance Volume (OBV) is increasing, supported by high volume, which typically suggests strong buying interest. The price is also above the Supertrend indicator, reinforcing the bullish sentiment. However, caution is advised as the price is below the Upper Band of the Bollinger Bands, indicating potential overbought conditions.
Conversely, several negative momentum indicators raise alarms. The Money Flow Index (MFI), Stochastic RSI, and WaveTrend all show bearish divergence, suggesting a potential reversal in momentum. Furthermore, the MACD has exhibited a negative histogram crossover, which is often a precursor to declining prices. The presence of strong resistance levels adds to the bearish outlook, indicating that the stock may struggle to maintain its upward trajectory.
In summary, while MA stock shows some bullish trends, the overwhelming presence of negative momentum indicators and strong resistance suggests that investors should approach with caution. The current recommendation leans towards a strong sell, as the risks of a downturn appear significant given the existing market conditions.
MA Fundamental Analysis
MA’s recent financial performance presents a compelling case for investment, characterized by strong profitability and growth potential. The company reported a positive net income of $3.26 billion for the most recent period, showcasing its robust profitability. Furthermore, the year-over-year increase in net income is a promising indicator for future performance. With an impressive operating margin of 100.00%, MA demonstrates exceptional operational efficiency and cost control, while a net profit margin of 46.80% highlights its strong ability to generate profits after accounting for all expenses.
However, there are some concerns regarding the company’s financial structure. The average net debt stands at a high $8.43 billion, which necessitates further scrutiny regarding its impact on financial flexibility. Additionally, a debt-to-equity ratio of -3.14 indicates a moderate level of leverage, which could raise concerns depending on the industry context.
In terms of valuation, MA’s forward P/E ratio of 29.95 suggests that the stock is priced for growth, reflecting investor confidence in future earnings. Conversely, the price-to-sales ratio of 17.29 is relatively high, indicating potential overvaluation when compared to revenue.
The company’s growth metrics are encouraging, with a revenue growth of 9.66% year-over-year and an earnings growth of 16.70%, suggesting strong future earnings potential. The high profit margins further demonstrate MA’s ability to generate profits efficiently.
From a shareholder perspective, the company shows positive signs with net cash from financing activities at $2.51 billion, indicating that it is raising capital for growth or debt reduction. Additionally, stock repurchases totaling $7.04 billion signal management’s confidence in the company’s future prospects.
Examining the income statement, MA reported a total revenue of $6.96 billion, establishing a solid revenue base. However, the interest expense of $153 million and negative net interest income of $153 million indicate potential challenges in managing debt costs.
On the balance sheet, a current ratio of 1.78 suggests a healthy liquidity position, allowing the company to comfortably cover its short-term liabilities. However, the cash to total assets ratio of 0.17 is relatively low, which may indicate limited financial flexibility. Additionally, the average tangible book value of -$4.97 billion raises concerns about the company’s net worth after liabilities.
In terms of cash flow, MA’s average capital expenditures of $926.75 million indicate that the company is investing in growth and expansion. The positive free cash flow of $12.01 billion further illustrates that the company has cash available for investments, debt reduction, or dividends.
Overall, MA exhibits strong profitability and growth potential, despite some concerns regarding its debt levels and valuation metrics. The positive indicators in financial health, growth, and cash flow support a buy recommendation. Investors should consider these factors when evaluating MA as a potential investment opportunity.
Financial Health
🟢 Net Income for the most recent period was positive at $3.26 billion, indicating strong profitability.
🟢 Year-over-year net income increased, which is a positive sign for future performance.
🟢 Operating Margin of 100.00% suggests exceptional operational efficiency and cost control.
🟢 Net Profit Margin of 46.80% reflects the company’s strong ability to generate profits after all expenses.
🔴 Average Net Debt is high at $8.43 billion, which requires further investigation into its impact on financial flexibility.
🔴 Debt-to-Equity Ratio of -3.14 indicates a moderate level of leverage, which may raise concerns depending on the industry context.
Valuation
🟢 Forward P/E ratio of 29.95 suggests that the stock is priced for growth, reflecting investor confidence in future earnings.
🔴 Price-to-Sales Ratio of 17.29 is relatively high, indicating potential overvaluation compared to revenue.
Growth and Profitability
🟢 Revenue Growth of 9.66% year-over-year indicates moderate growth, which is a positive sign for the stock price.
🟢 Earnings Growth of 16.70% suggests strong future earnings potential.
🟢 High profit margins demonstrate the company’s ability to generate profits efficiently.
Shareholder Information
🟢 Positive net cash from financing activities at $2.51 billion indicates the company is raising capital for growth or debt reduction.
🟢 Stock repurchases of $7.04 billion can signal management’s confidence in the company’s future prospects.
Income Statement
🟢 Total revenue for the most recent period was $6.96 billion, showing a solid revenue base.
🔴 Interest expense of $153 million and negative net interest income of $153 million indicate potential challenges in managing debt costs.
Balance Sheet
🟢 Current Ratio of 1.78 indicates a healthy liquidity position, suggesting the company can comfortably cover its short-term liabilities.
🔴 Cash to Total Assets Ratio of 0.17 is relatively low, which might indicate limited financial flexibility.
🔴 Average Tangible Book Value of -$4.97 billion raises concerns about the company’s net worth after liabilities.
Cashflow
🟢 Average Capital Expenditures of $926.75 million suggest the company is investing in growth and expansion.
🟢 Positive free cash flow of $12.01 billion indicates the company has cash available for investments, debt reduction, or dividends.
Overall, the company shows strong profitability and growth potential, despite some concerns regarding debt levels and valuation metrics. The positive indicators in financial health, growth, and cash flow support a buy recommendation.
MA News Analysis
Mastercard (MA) shows a generally positive outlook with several developments that could enhance its market position and investor confidence.
Summary of Mastercard news indicates a favorable environment for investors. The announcement of a quarterly dividend and the growth of a Mastercard-linked money manager are strong indicators of financial health. However, the news about the CFO’s health is a concern. Overall, the positive developments outweigh the negatives, suggesting a buy recommendation.
🟢 Mastercard’s Board of Directors has announced a quarterly dividend, reflecting the company’s commitment to returning value to shareholders.
🟢 This dividend announcement is a positive sign of financial stability and could attract income-focused investors.
🟢 A Mastercard-linked money manager has reported growth with recruits from the Ontario Teachers’ Fund, indicating strong partnerships and potential for increased asset management.
🟢 The introduction of Tap & Go in Beijing for visitors enhances Mastercard’s presence in a key market, potentially driving transaction volumes.
🔴 However, the news regarding CFO Sachin Mehra’s remote work due to a Non-Hodgkin Lymphoma diagnosis raises concerns about leadership stability.
🟢 An analysis highlights Mastercard as one of the best dividend stocks to buy, reinforcing its attractiveness to investors.
🟢 Additionally, Mastercard is recognized as one of the best fintech stocks to buy in 2024, suggesting strong growth potential in the fintech sector.
MA Holders Analysis
The financial health and ownership structure of Mastercard (MA) indicate a strong buy recommendation for the next month. The combination of high insider and institutional ownership, along with positive recent insider transactions, supports this outlook.
🟢 Mastercard has a high insider ownership of 10.60%, which suggests strong alignment between management and shareholders, a generally positive sign for investors.
🟢 The institutional ownership stands at 79.64%, indicating significant interest from large investors. This level of institutional backing typically reflects confidence in the company’s future performance.
🟢 The number of institutional holders is substantial at 4096, which indicates a diversified ownership base and widespread institutional interest.
🟢 Recent insider transactions show a mix of purchases and sales, but the overall sentiment remains positive, with more purchases than sales in the last six months.
🟡 The insider roster indicates ongoing engagement from key executives, which is a good sign for the company’s strategic direction.
🔴 While there is some volatility risk due to high institutional ownership, the overall trend in institutional buying suggests confidence in the stock’s performance.
MA Analyst Ratings
The analyst ratings for MA (Mastercard) are predominantly positive, with a significant number of analysts recommending either a buy or strong buy. Over the past three months, there have been 14 strong buy ratings, 20 buy ratings, 4 hold ratings, 1 sell rating, and no strong sell ratings. This indicates a strong bullish sentiment among analysts. 🟢
The recent upgrades from firms like JP Morgan, BMO Capital, and Barclays, all maintaining an overweight or outperform rating, further reinforce this positive outlook. The consistent recommendation for buying suggests that analysts are confident in the company’s growth potential and market position.
In the past month, the stock has shown resilience and is likely to continue this trend, supported by strong consumer spending and digital payment growth. Given the current analyst sentiment and market conditions, it is reasonable to forecast that MA will perform well in the next month, potentially reaching a price target of around 400, reflecting a modest upside from current levels.
Overall, the strong buy and buy recommendations, combined with the lack of negative ratings, suggest a favorable outlook for MA in the near term.
MA Economic Analysis
Based on the US economic and market data:
🟢 The **unemployment rate** has increased slightly to **4.3%**, but this is still relatively low, indicating a stable labor market that supports consumer spending.
🟢 **Retail sales** have shown a significant increase to **627,510**, suggesting strong consumer demand, which is beneficial for Mastercard’s transaction volumes.
🟢 The **GDP** growth rate remains robust at **5737.189**, indicating a healthy economy that typically supports higher corporate earnings.
🟢 The **CPI** data shows inflation is stable, which reduces the likelihood of aggressive interest rate hikes, creating a favorable environment for growth stocks like Mastercard.
🟢 Mastercard’s **profit margins** are strong at **46.4%**, and the company has shown consistent revenue growth of **11%**, which is a positive indicator for future performance.
Overall, the combination of stable economic indicators and Mastercard’s strong fundamentals suggests a positive outlook for the stock price in the next month. The target price estimates range from **453.34** to **550.00**, with a mean target of **518.86**, indicating potential upside from the current price of **497.71**.
In summary, the economic indicators and Mastercard’s performance suggest a **buy** recommendation with a **high confidence** level.
Disclaimer
Investors may consider the AI predictions and news summaries as one factor in their investment decisions alongside their own research and risk tolerance.

