META Stock Analysis: A Mixed Outlook for Investors
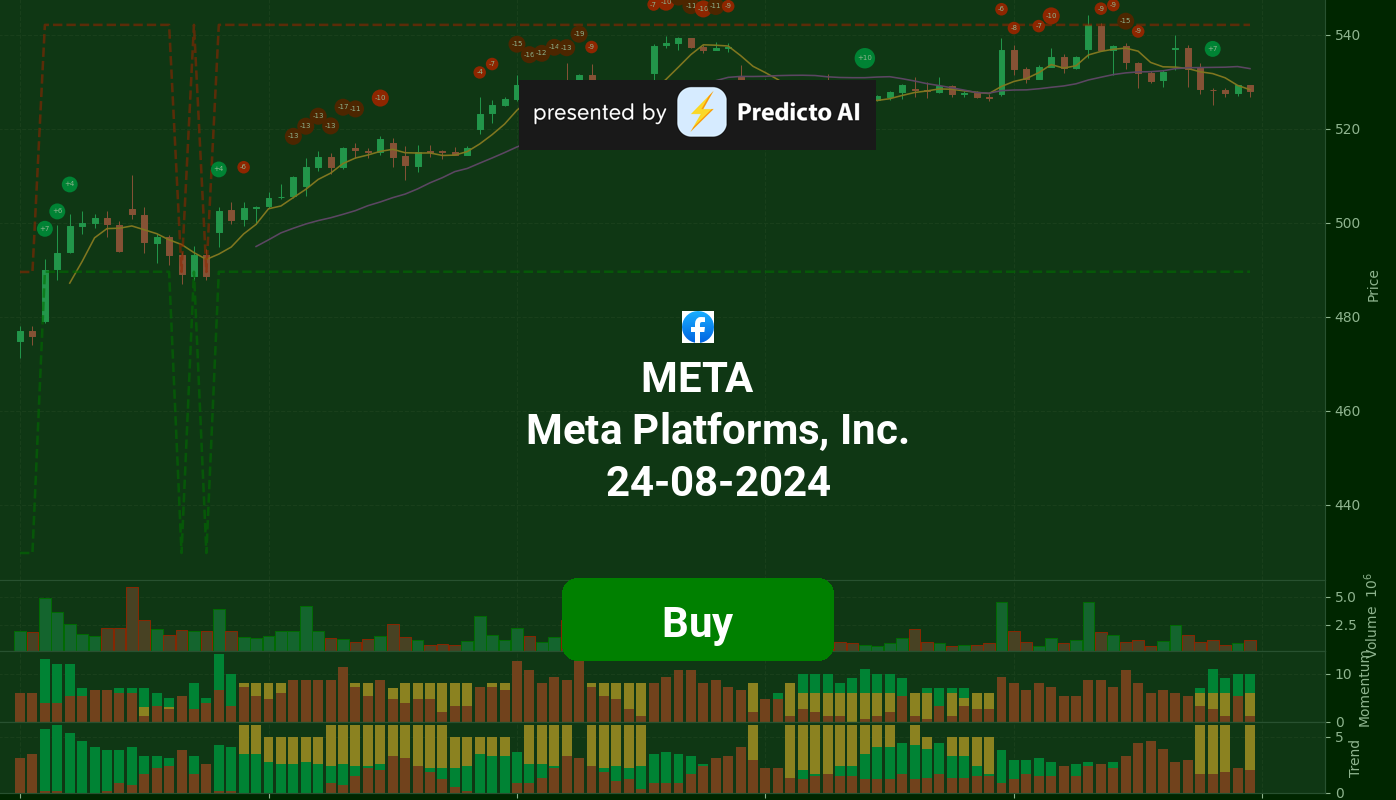
🔵 Recommendation: META stock is currently rated as a buy, presenting potential upside despite a complex landscape of mixed momentum indicators.
📈 Key Highlights:
Financial Health: Strong net income of $13.47 billion and impressive operating margin of 99.00% reflect robust profitability.
Growth: Exceptional earnings growth of 73.20% showcases META’s solid business performance.
Institutional Support: High institutional ownership at 79.05% indicates significant confidence from large investors.
⚠️ Caution Flags:
Negative Momentum Signals: Bearish divergence in WaveTrend and decreasing On-Balance Volume suggest underlying weakness.
Insider Selling: Significant sales by CEO Mark Zuckerberg raise concerns about insider sentiment.
As we delve deeper into the analysis, we will explore price trends, technical indicators, financial metrics, and the latest news impacting META’s stock performance. Stay tuned for a comprehensive breakdown of what lies ahead for this tech giant! 👇
META Price Analysis
| Positive Momentum Signals | Negative Momentum Signals | Hold Momentum Signals |
|---|---|---|
|
|
|
| Positive Trend Signals | Negative Trend Signals | Hold Trend Signals |
|---|---|---|
|
|
|
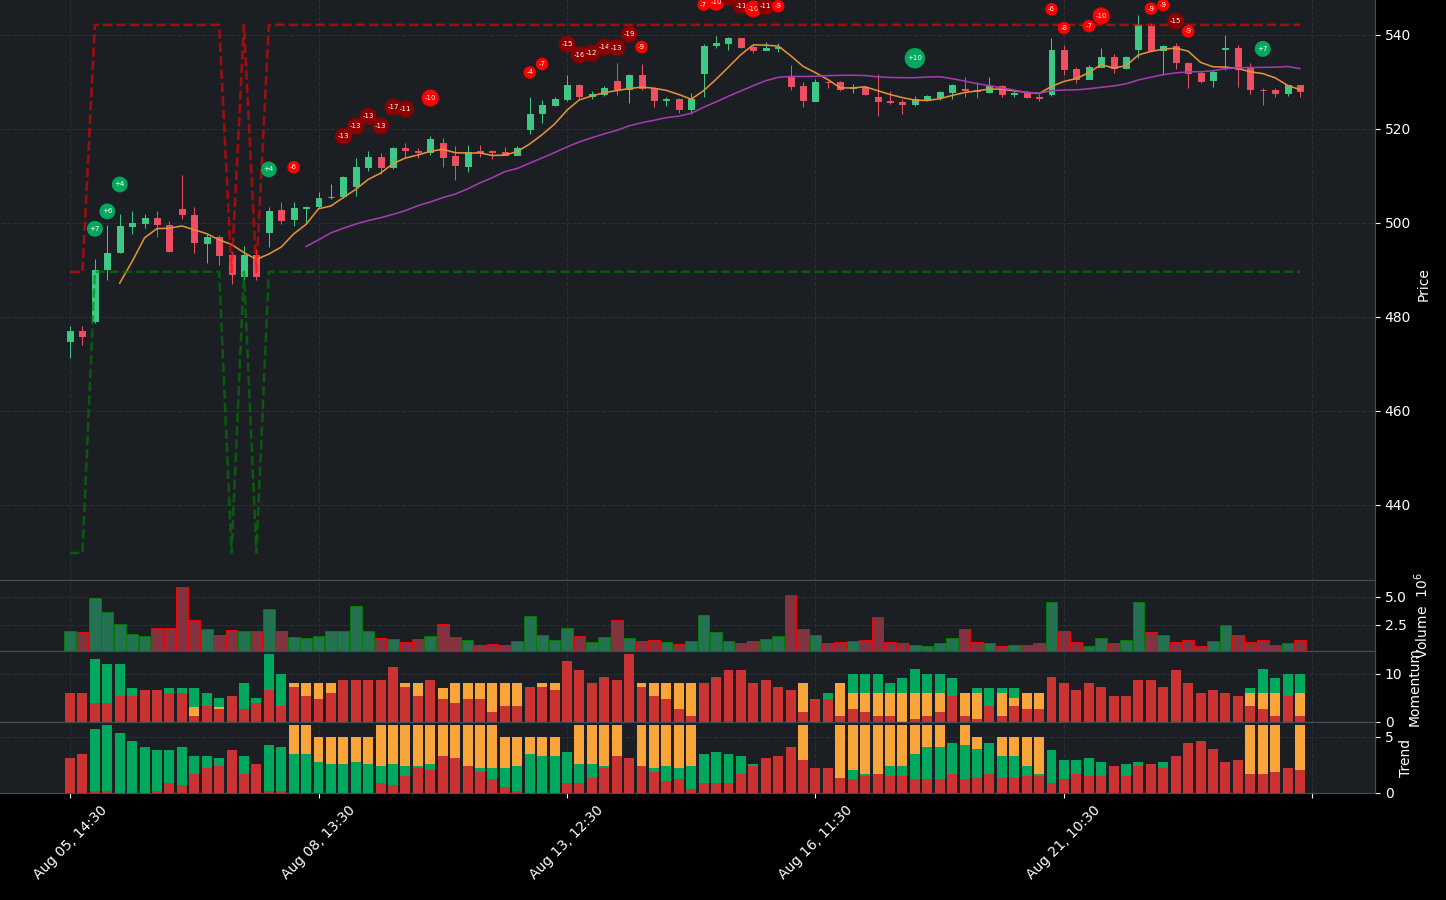
META stock presents a complex picture for investors. Currently, the stock is rated as a buy, indicating potential upside despite mixed momentum indicators. On the positive side, the StochRSI and WaveTrend indicators suggest that the stock is oversold, which could indicate a potential bottom and an opportunity for recovery.
However, caution is warranted due to some negative momentum signals. The WaveTrend shows a bearish divergence, which may suggest a potential reversal in the stock’s price trend. This divergence could indicate that while the price is currently low, there may be underlying weakness that could lead to further declines.
From a trend perspective, META is showing some bullish signs. The price is above the 200-day EMA, indicating a bullish trend, and the EMA 200 is strengthening. Additionally, the MACD has shown a positive histogram crossover, which is typically a bullish signal. However, the stock is currently below the middle band of its trading range and above the lower band, suggesting it is in a downtrend but may be experiencing oversold conditions.
On the downside, the On-Balance Volume (OBV) is decreasing, which could indicate that selling pressure is outweighing buying pressure. Furthermore, the stock is below the 50-day EMA, which is a bearish trend indicator, and the Supertrend is also bearish, reinforcing the notion that the stock is currently under pressure.
In summary, while META stock has some positive indicators that suggest a potential rebound, the presence of bearish signals and a mixed trend analysis indicates that investors should proceed with caution. A buy recommendation is appropriate, but it is essential to monitor the stock closely for any signs of reversal or further weakness. Investors should be prepared for volatility and consider their risk tolerance before making any decisions.
META Fundamental Analysis
META’s recent financial performance presents a compelling investment opportunity, characterized by strong profitability and growth metrics. The company reported a positive Net Income of $13.47 billion for the most recent period, reflecting robust profitability. Notably, the year-over-year increase in net income signals a positive trajectory for future performance.
The company’s Operating Margin stands at an impressive 99.00%, indicating highly efficient operations and excellent cost control. Additionally, a Net Profit Margin of 34.46% underscores META’s strong ability to generate profits after accounting for all expenses. However, it is important to note that the Cash to Total Assets Ratio is relatively low at 0.16, which may indicate limited financial flexibility and potential vulnerability to economic shocks.
In terms of Valuation, META’s forward P/E ratio of 24.38 suggests a reasonable valuation, especially in light of its strong earnings growth of 73.20%. Conversely, the Price-to-Sales Ratio of 8.92 raises concerns about potential overvaluation relative to its revenue generation.
Looking at Growth and Profitability, META has demonstrated a year-over-year Revenue Growth of 7.18%, which is a positive indicator for stock price appreciation. The exceptional Earnings Growth of 73.20% showcases robust business performance, while high profit margins further illustrate the company’s efficiency in generating profits.
From a Shareholder Information perspective, META has engaged in significant stock repurchases amounting to $24.63 billion, reflecting a commitment to returning value to shareholders by reducing the number of shares outstanding. The average ordinary shares outstanding at 2.56 billion suggest a stable shareholder base.
Analyzing the Income Statement, META’s total revenue for the most recent period was $39.07 billion, indicating strong sales performance. The operating and net profit margins reinforce the company’s strong operational efficiency and profitability.
On the Balance Sheet, a current ratio of 2.47 indicates a healthy liquidity position, suggesting that the company can comfortably cover its short-term liabilities. The Debt-to-Equity Ratio of 0.29 indicates a moderate level of leverage, which is manageable but should be monitored. Furthermore, an average tangible book value of $126.12 billion represents a solid net worth after liabilities.
In terms of Cashflow, META boasts a positive free cash flow of $32.01 billion, indicating ample cash available for investments, debt reduction, or dividends. The average capital expenditures of $23.14 billion suggest ongoing investment in growth and expansion, while positive net cash from financing of $5.39 billion indicates successful capital-raising efforts.
Overall, META demonstrates strong financial health, robust growth, and effective profitability metrics, making it a favorable investment opportunity. Investors may consider adding META to their portfolios, given its solid fundamentals and growth potential.
Financial Health
🟢 Net Income for the most recent period was positive at $13.47 billion, indicating strong profitability.
🟢 Year-over-year net income increased, which is a positive sign for future performance.
🟢 Operating Margin of 99.00% suggests highly efficient operations and excellent cost control.
🟢 Net Profit Margin of 34.46% reflects the company’s strong ability to generate profits after all expenses.
🔴 Cash to Total Assets Ratio is relatively low at 0.16, indicating limited financial flexibility and potential vulnerability to economic shocks.
Valuation
🟢 Forward P/E ratio of 24.38 suggests reasonable valuation given the strong earnings growth of 73.20%.
🔴 Price-to-Sales Ratio of 8.92 indicates the stock may be overvalued relative to its revenue generation.
Growth and Profitability
🟢 Revenue Growth of 7.18% year-over-year indicates moderate growth, which is positive for the stock price.
🟢 Earnings Growth of 73.20% is exceptionally strong, showcasing robust business performance.
🟢 High profit margins demonstrate the company’s ability to generate profits efficiently.
Shareholder Information
🟢 Stock Repurchases of $24.63 billion indicate a commitment to returning value to shareholders by reducing the number of shares outstanding.
🟢 Average Ordinary Shares Outstanding at 2.56 billion suggests a stable shareholder base.
Income Statement
🟢 Total Revenue for the most recent period was $39.07 billion, indicating strong sales performance.
🟢 Operating Margin of 99.00% and Net Profit Margin of 34.46% reflect the company’s strong operational efficiency and profitability.
Balance Sheet
🟢 Current Ratio of 2.47 indicates a healthy liquidity position, suggesting the company can comfortably cover its short-term liabilities.
🔴 Debt-to-Equity Ratio of 0.29 suggests a moderate level of leverage, which may be sustainable but requires monitoring.
🟢 Average Tangible Book Value of $126.12 billion represents a solid net worth after liabilities.
Cashflow
🟢 Positive Free Cash Flow of $32.01 billion indicates the company has cash available for investments, debt reduction, or dividends.
🟢 Average Capital Expenditures of $23.14 billion suggest ongoing investment in growth and expansion.
🟢 Positive Net Cash from Financing of $5.39 billion indicates successful capital raising efforts.
Overall, META demonstrates strong financial health, robust growth, and effective profitability metrics, making it a favorable investment opportunity.
META News Analysis
META News: A mixed outlook for investors.
The news surrounding Meta Platforms, Inc. (META) presents a combination of positive and negative factors that could influence investor sentiment. While there are optimistic projections regarding its growth potential and market positioning, there are also concerns related to security breaches and competition in the AI space. Investors should weigh these factors carefully.
🟢 A recent article from Motley Fool highlights that META could join the $3 trillion club by 2031, indicating strong growth potential alongside tech giants like Apple and Microsoft.
🟢 The focus on AI and technology investments is crucial, as seen in the Yahoo Finance video explaining key terms in AI investing, which could enhance META’s market relevance.
🔴 However, concerns arise from reports of Iranian hackers targeting WhatsApp accounts of staffers in previous administrations, which could pose reputational risks for META.
🟢 Investor’s Business Daily notes that META stock is leading among several names near buy points, suggesting a favorable technical setup for potential investors.
🔴 Additionally, the hiring of a former Meta executive by OpenAI could indicate competitive pressures in the AI sector, which may impact META’s strategic initiatives.
META Holders Analysis
The financial health of META shows a mixed outlook, with strong institutional backing but concerning insider selling activity.
🟢 META has a **high institutional ownership** at **79.05%**, indicating significant interest from large investors, which typically suggests confidence in the company’s future performance. Major holders like Vanguard and Blackrock are substantial players, reflecting a robust institutional belief in META’s potential.
🟡 The **insider ownership is very low at 0.17%**, which may indicate a lack of confidence from company management or a high degree of external control. This could lead to volatility if institutional investors decide to sell.
🔴 Recent **insider transactions reveal significant selling** by CEO Mark Zuckerberg, with multiple sales occurring at prices ranging from **$523 to $539** per share. This level of selling raises concerns about insider sentiment and could signal potential issues within the company.
🟡 The number of institutional holders is quite large at **5176**, suggesting a diversified ownership structure, which can help stabilize the stock price against individual investor actions.
🟢 Despite the insider selling, the overall market sentiment remains cautiously optimistic, with analysts maintaining a positive outlook on META’s growth prospects, particularly in the advertising and virtual reality sectors.
META Analyst Ratings
The analyst ratings for META have shown a strong positive trend, particularly in the last month where there were 20 strong buy ratings and 35 buy ratings, indicating a bullish sentiment among analysts. The recent upgrades from Tigress Financial to Strong Buy and consistent Buy ratings from firms like Loop Capital and Deutsche Bank reinforce this positive outlook.
🟢 Over the past month, the ratings reflect a significant confidence in META’s performance, with only 2 sell ratings and no strong sell ratings. This suggests that analysts are optimistic about the company’s growth potential.
🟢 Given the strong analyst support and the positive sentiment surrounding META, it is likely that the stock will perform well in the next month, with a forecasted price increase of around 5-10%. The high confidence level indicates a strong belief in this projection.
META Economic Analysis
Based on the US economic and market data:
🟢 The **unemployment rate has decreased to 4.3%**, indicating a strengthening labor market. This typically leads to increased consumer spending, which can positively impact Meta’s advertising revenue.
🟢 **Retail sales have shown an increase**, with the latest figure at **627,510**, suggesting robust consumer demand. This is beneficial for Meta, as higher consumer spending can lead to increased engagement on its platforms, driving ad revenue.
🟢 The **trailing PE ratio of 27.02** indicates that Meta is reasonably valued compared to its growth potential, especially considering its **earnings growth of 73.2%**. This growth rate is significantly higher than many competitors in the tech sector.
🔴 The **Federal Funds Rate remains high at 5.33%**, which could lead to increased borrowing costs for consumers and businesses. However, Meta’s strong cash position of **58 billion** allows it to weather potential economic downturns better than many peers.
🟡 The **NASDAQ index has not shown recent data**, but historically, it has been a strong indicator of tech stock performance. Meta’s strong fundamentals could help it outperform the index if it rebounds.
Overall, the combination of a strong labor market, increasing retail sales, and solid earnings growth supports a positive outlook for Meta’s stock price over the next month. The target price range suggests potential upside, with a target high of **581.98** and a mean target of **506.5**.
In conclusion, the economic indicators and Meta’s strong fundamentals lead to a **buy recommendation** for the next month.
Disclaimer
Investors may consider the AI predictions and news summaries as one factor in their investment decisions alongside their own research and risk tolerance.

