MMC Stock Analysis: A Mixed Outlook for Investors
🔴 Recommendation: MMC is currently rated as a strong buy, but investors should proceed with caution due to significant bearish trends and mixed financial indicators.
📈 Key Highlights:
Momentum Indicators: Positive signals from the Money Flow Index (MFI) and Stochastic RSI suggest the stock may be oversold, indicating potential for a rebound.
Financial Health: Despite a positive net income of $747 million, year-over-year revenue has declined by 8.42%, raising concerns about future profitability.
Institutional Ownership: High institutional ownership at 90.95% reflects strong interest from large investors, providing some stability.
⚠️ Caution Flags:
Debt Levels: High average net debt of $11.162 billion and a low current ratio of 0.35 indicate potential liquidity risks.
Valuation Metrics: Forward P/E ratio of 23.14 and a price-to-sales ratio of 4.53 suggest the stock may be overvalued relative to its earnings potential.
As we delve deeper into the analysis, we will explore the price trends, detailed indicators, financial health, valuation metrics, and more to provide a comprehensive view of MMC’s investment potential. Stay tuned for an in-depth breakdown! 👇
MMC Price Analysis

| Positive Momentum Signals | Negative Momentum Signals | Hold Momentum Signals |
|---|---|---|
|
|
| Positive Trend Signals | Negative Trend Signals | Hold Trend Signals |
|---|---|---|
|
|
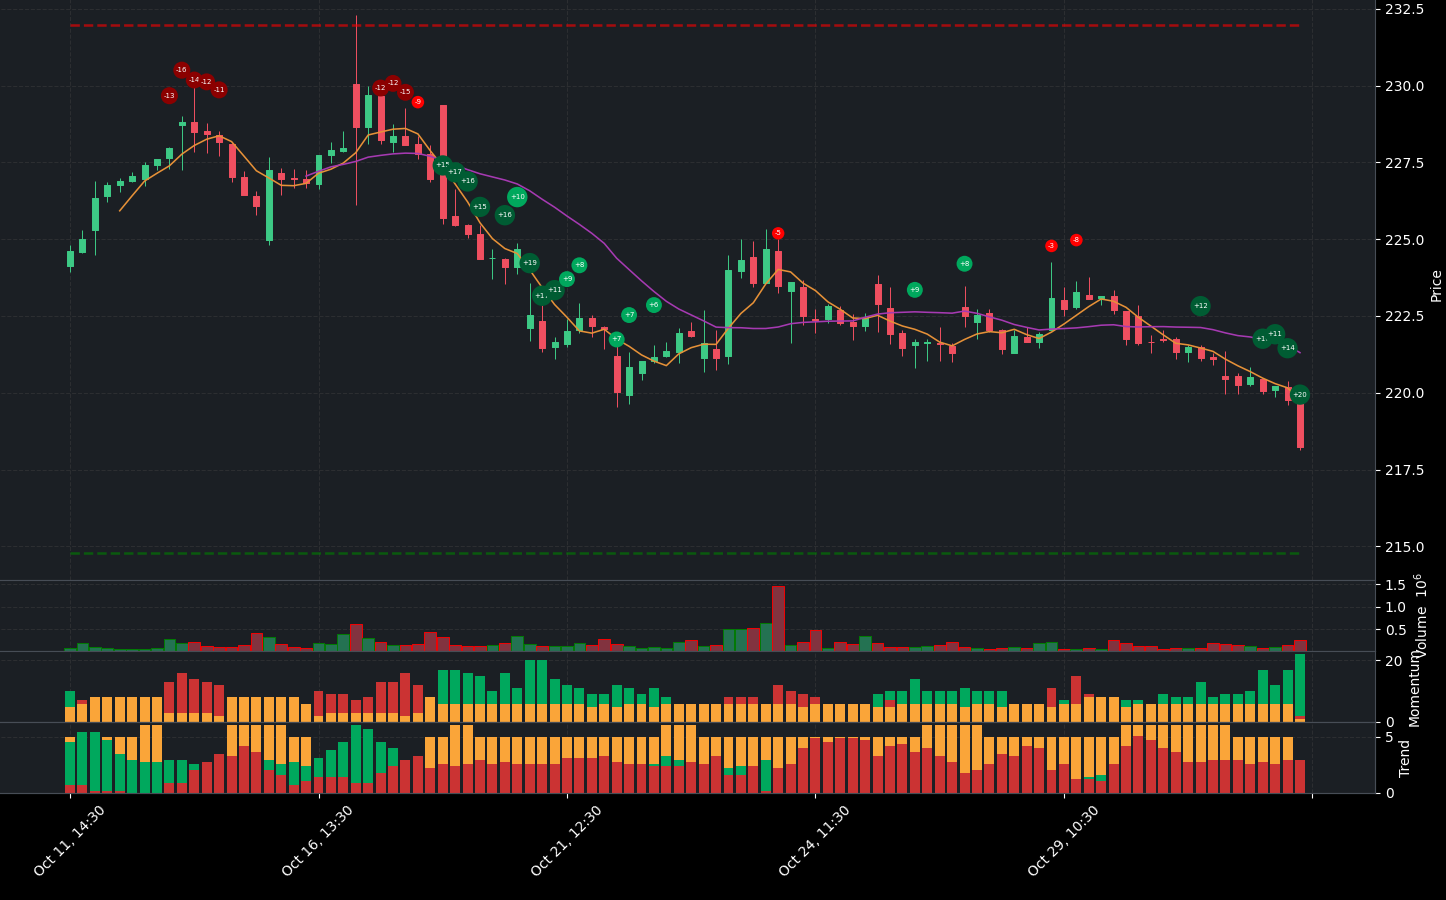
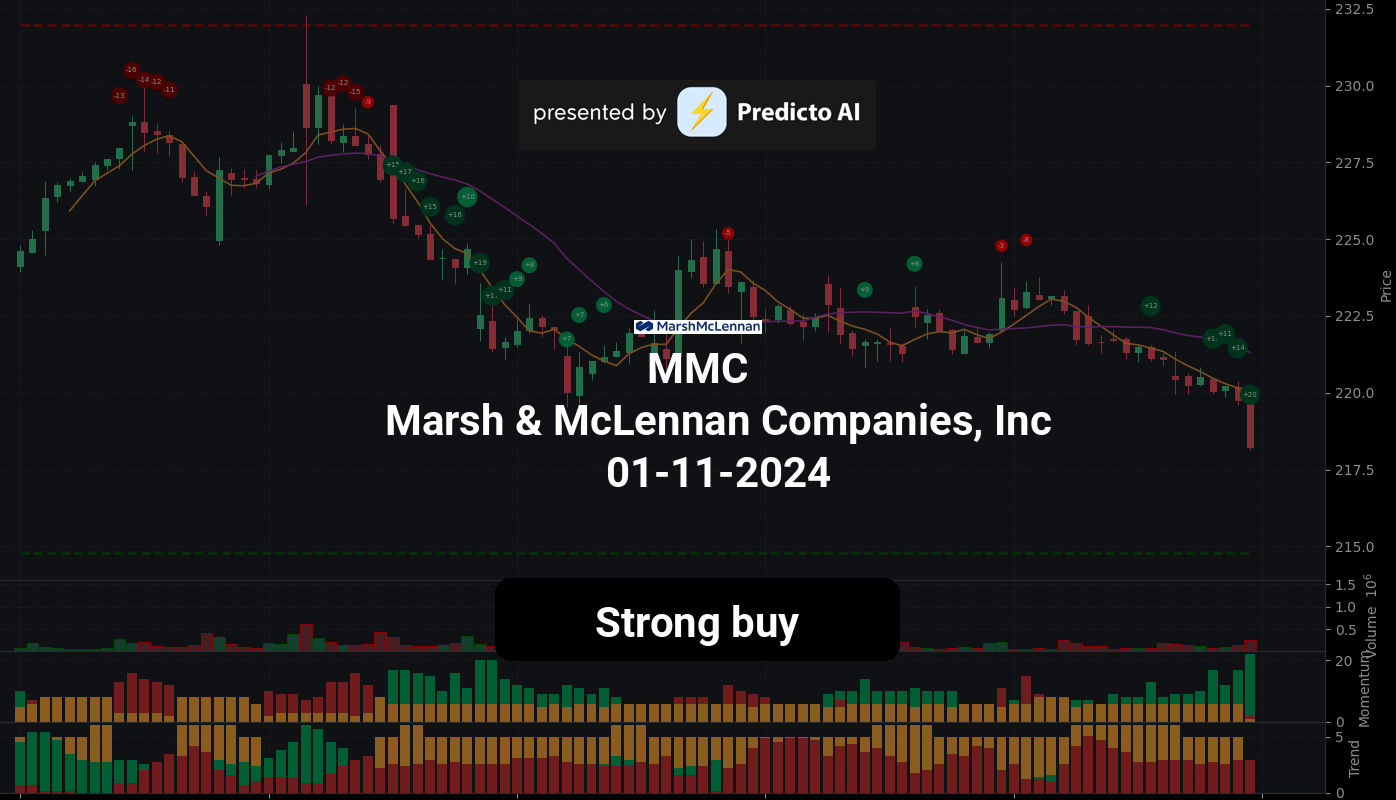
MMC stock presents a complex picture for investors. Currently rated as a strong buy, the stock shows several positive momentum indicators that suggest it may be oversold. Notably, the Money Flow Index (MFI) indicates oversold conditions and a bullish divergence, while the Stochastic RSI also reflects oversold status with a bullish divergence. Additionally, the WaveTrend indicator suggests a potential bottom, and the Relative Strength Index (RSI) is moderately bullish, indicating that the stock is closer to support levels.
However, caution is warranted due to significant negative trend indicators. The stock has experienced a price breakdown below the lower band on high volume, which could signal the beginning of a new bearish trend. The On-Balance Volume (OBV) is decreasing, and both the 50-day and 200-day Exponential Moving Averages (EMAs) indicate a strengthening bearish trend, with the price trading below these averages. Furthermore, the Supertrend indicator confirms a bearish trend, as the price remains below this level.
In summary, while MMC stock shows signs of being oversold and presents some positive momentum indicators, the prevailing bearish trends and breakdowns suggest a cautious approach. Investors may consider buying or tightening stop-loss orders, but should remain vigilant about the potential for further declines. A balanced strategy that weighs both the positive and negative indicators is advisable as the market conditions evolve.
MMC Fundamental Analysis
MMC’s recent financial performance presents a mixed picture, characterized by both strengths and weaknesses. On one hand, the company demonstrates strong operational efficiency with an impressive operating margin of 100.32% and a net profit margin of 13.11%, indicating its ability to generate profits after accounting for expenses. Additionally, MMC has shown positive earnings growth of 2.70%, suggesting some momentum in profitability.
However, these positives are tempered by concerning trends in revenue and financial health. The total revenue for the most recent period was $5.697 billion, reflecting a significant year-over-year decline of -8.42%. This drop raises alarms about the company’s future growth prospects and its ability to sustain profitability. Furthermore, the net income decreased to $747 million compared to previous periods, which could signal challenges ahead.
The company’s financial health is further complicated by high levels of debt. The average net debt stands at $11.162 billion, and the debt-to-equity ratio is concerningly high at 106.46, indicating potential financial risk. Additionally, the current ratio is low at 0.35, suggesting liquidity risks in meeting short-term obligations, while the cash to total assets ratio is a mere 0.05, highlighting limited financial flexibility.
Valuation metrics also raise red flags, with a forward P/E ratio of 23.14 and a price-to-sales ratio of 4.53, both suggesting that the stock may be overvalued relative to its earnings potential. The negative net interest income of -$142 million further complicates the outlook, indicating that the company is paying more in interest than it earns on its assets.
On a more positive note, MMC’s average free cash flow is healthy at $3.657 billion, and the company has been investing in growth with average capital expenditures of $410 million. The positive net cash from financing of $2.521 billion indicates that the company is actively raising capital, which could support growth initiatives or debt reduction.
In summary, while MMC exhibits strong operational efficiency and some positive growth indicators, the concerning trends in revenue, high debt levels, and potential overvaluation create a neutral sentiment overall. Investors should carefully weigh these factors and consider the company’s ability to navigate its financial challenges before making any investment decisions.
Financial Health
🔴 Net Income for the most recent period was $747 million, but year-over-year net income decreased, raising concerns about future profitability.
🔴 Total Revenue for the most recent period was $5.697 billion, with a year-over-year revenue growth of -8.42%, indicating a decline in revenue that could negatively impact the stock price.
🟢 Operating Margin was 100.32%, suggesting efficient operations and good cost control.
🟢 Net Profit Margin was 13.11%, reflecting the company’s ability to generate profits after all expenses.
🔴 Average Net Debt is high at $11.162 billion, which warrants further investigation into its impact on financial flexibility.
🔴 Current Ratio is low at 0.35, indicating potential liquidity risk in meeting short-term obligations.
🔴 Cash to Total Assets Ratio is low at 0.05, suggesting limited financial flexibility and vulnerability to economic shocks.
Valuation
🔴 Forward P/E ratio is 23.14, which may suggest the stock is overvalued relative to its earnings potential.
🔴 Price-to-Sales Ratio is high at 4.53, indicating potential overvaluation.
Growth and Profitability
🟢 Earnings Growth is positive at 2.70%, indicating some growth momentum.
🔴 Revenue Growth is negative at -8.42%, reflecting challenges in revenue generation.
🟢 Operating Margins are strong at 20.99%, indicating good operational efficiency.
🔴 Net Interest Income is negative at -$142 million, suggesting the company is paying more in interest than it earns on its assets.
Shareholder Information
🟢 Average Ordinary Shares Outstanding is 492 million, indicating a stable number of shares held by investors.
🟢 Average Treasury Shares at 68 million could indicate management’s confidence in the company’s future prospects through share buybacks.
Income Statement
🟢 Net Income for the most recent period was positive at $747 million, showing profitability despite the decline in revenue.
🔴 Year-over-year revenue growth was -8.42%, indicating a concerning trend.
🟢 Operating Margin of 100.32% suggests efficient operations.
🟢 Net Profit Margin of 13.11% reflects the company’s ability to generate profits after expenses.
Balance Sheet
🔴 Debt-to-Equity Ratio is high at 106.46, raising concerns about financial risk.
🔴 Average Tangible Book Value is negative at -$7.399 billion, indicating a concerning financial position.
🔴 Average Total Debt is high at $15.325 billion, necessitating further analysis of its composition and terms.
Cashflow
🟢 Average Free Cash Flow is positive at $3.657 billion, indicating healthy cash generation.
🟢 Average Capital Expenditures of $410 million suggest investment in growth and expansion.
🟢 Net Cash from Financing is positive at $2.521 billion, indicating capital raising activities that could support growth or debt reduction.
Overall, the company shows a mixed financial picture with strong operational efficiency but concerning trends in revenue and high levels of debt. The sentiment remains neutral due to the balance of positive and negative factors.
MMC News Analysis
MMC News: A mixed outlook for investors.
The news surrounding Marsh & McLennan Companies, Inc. (MMC) presents a mixed picture for investors. While Aflac’s strong earnings and WTW’s positive performance are encouraging, MetLife’s earnings miss and the large notes offering raise concerns. Investors should weigh these factors carefully.
🟢 Aflac (AFL) reported Q3 earnings that exceeded estimates, driven by lower benefits and expenses, which is a positive indicator for the insurance sector, including MMC.
🔴 Conversely, MetLife (MET) missed Q3 earnings expectations due to a weak group benefits unit and high costs, suggesting potential challenges in the industry that could impact MMC.
🟢 WTW’s (WTW) Q3 earnings also topped expectations, indicating strong revenue growth and successful transformation efforts, which may reflect positively on MMC’s market position.
🔴 Marsh & McLennan’s recent pricing of a $7.25 billion notes offering could indicate a need for capital, which may raise concerns about debt levels and financial stability.
🔴 The broader trend of corporate borrowers flocking to the bond market ahead of elections may suggest increased volatility and uncertainty in the market, which could affect MMC’s stock performance.
🟢 Brown & Brown (BRO) also reported strong earnings, which may reflect positively on the overall insurance brokerage sector, including MMC.
🔴 However, Amerisafe’s stock gains following its earnings beat could indicate competitive pressures in the market that MMC needs to navigate.
MMC Holders Analysis
The financial health of MMC presents a mixed outlook for the next month. While there are positive indicators from institutional ownership, the low insider ownership and recent insider transactions raise some concerns.
🟢 MMC has a **high institutional ownership** at **90.95%**, indicating strong interest from large investors, which typically suggests confidence in the company’s future performance. This level of institutional backing can provide stability and support for the stock price.
🔴 However, the **insider ownership is very low at 0.10%**, which may indicate a lack of confidence from company management or a high degree of external control. This could lead to volatility if institutional investors decide to sell.
🟡 The number of institutional holders is substantial at **2012**, suggesting a diversified ownership base, which can mitigate risks associated with individual investors’ actions.
🟡 Recent insider transactions show a **mix of sales and purchases**, with a higher percentage of sales compared to purchases. This could indicate that insiders are cashing out, which may not be a positive sign for potential investors.
🔴 The overall sentiment from insider transactions is somewhat negative, as the majority of recent activity has been sales rather than purchases, which could reflect a lack of confidence in the near-term prospects of the company.
In summary, while the institutional backing is strong, the low insider ownership and mixed insider transaction activity suggest a cautious approach. Therefore, the recommendation is to hold MMC stock for the next month, monitoring for any changes in insider activity or institutional sentiment that could influence the stock’s performance.
MMC Analyst Ratings
The analyst ratings for MMC show a mixed sentiment, with a notable number of hold ratings. In the most recent month, there were 4 strong buy ratings, 7 buy ratings, and 8 hold ratings, indicating a generally positive outlook but with some caution. The absence of sell or strong sell ratings suggests that analysts are not overly bearish on the stock.
🟡 Over the past month, the distribution of ratings indicates a cautious optimism, with 4 strong buy, 7 buy, and 8 hold ratings. This reflects a moderate bullish sentiment among analysts.
🟢 Given the recent analyst ratings and the lack of negative recommendations, it is likely that the stock will see some upward movement in the next month, potentially in the range of 2-5%. However, the medium confidence level indicates that investors should remain vigilant for any changes in market conditions or company performance.
MMC Economic Analysis
Based on the US economic and market data:
🔴 The unemployment rate has increased to 4.3%, up from 4.1% in the previous month, indicating a potential slowdown in the labor market. This could lead to decreased consumer spending, negatively impacting companies like Marsh & McLennan Companies (MMC) that rely on robust economic activity for their consulting and insurance services.
🟡 Retail sales have shown a modest increase, but the growth rate is not strong enough to suggest a significant boost in consumer confidence. The latest figure of 627,510.0 is an improvement, but it may not be sufficient to drive substantial revenue growth for MMC.
🟢 The GDP growth rate remains stable, which is a positive sign for the overall economy. A stable GDP of 5737.189 suggests that the economy is not in recession, which is generally favorable for financial services companies.
🔴 The rising Treasury yield at 4.25% could lead to higher borrowing costs for companies, including MMC, which may affect their profitability and investment strategies.
Overall, the mixed signals from the economic indicators suggest that while there are some positive aspects, the increasing unemployment rate and rising yields present challenges. Therefore, I would recommend a cautious approach to investing in MMC over the next month, with a price target range of 212.0 to 233.56.
In summary, the outlook for MMC is more negative than neutral, given the current economic conditions.
Disclaimer
Investors may consider the AI predictions and news summaries as one factor in their investment decisions alongside their own research and risk tolerance.


