NVIDIA Corporation (NVDA) Stock Analysis: A Mixed Bag of Opportunities and Cautions
🔵 Recommendation: NVDA presents a complex investment landscape with strong bullish indicators, yet caution is warranted due to some negative signals.
📈 Key Highlights:
Financial Performance: Impressive net income of $16.60 billion and a year-over-year increase in profitability.
Growth Potential: Exceptional earnings growth of 168.00% and revenue growth of 122.40%, indicating robust demand for NVIDIA’s products.
Market Position: High institutional ownership at 66.76% reflects confidence from major investors in NVIDIA’s future.
⚠️ Caution Flags:
Liquidity Concerns: A current ratio of 0.67 suggests potential challenges in meeting short-term obligations.
Decreasing Buying Pressure: A declining On-Balance Volume (OBV) raises questions about the sustainability of the current uptrend.
As we delve deeper into the analysis, we will explore the price trends, technical indicators, financial health, valuation metrics, and recent news that shape the outlook for NVDA. Let’s break down the details and uncover what lies ahead for this leading player in the semiconductor industry. 👇
NVDA Price Analysis

| Positive Momentum Signals | Negative Momentum Signals | Hold Momentum Signals |
|---|---|---|
|
|
|
| Positive Trend Signals | Negative Trend Signals | Hold Trend Signals |
|---|---|---|
|
|
|
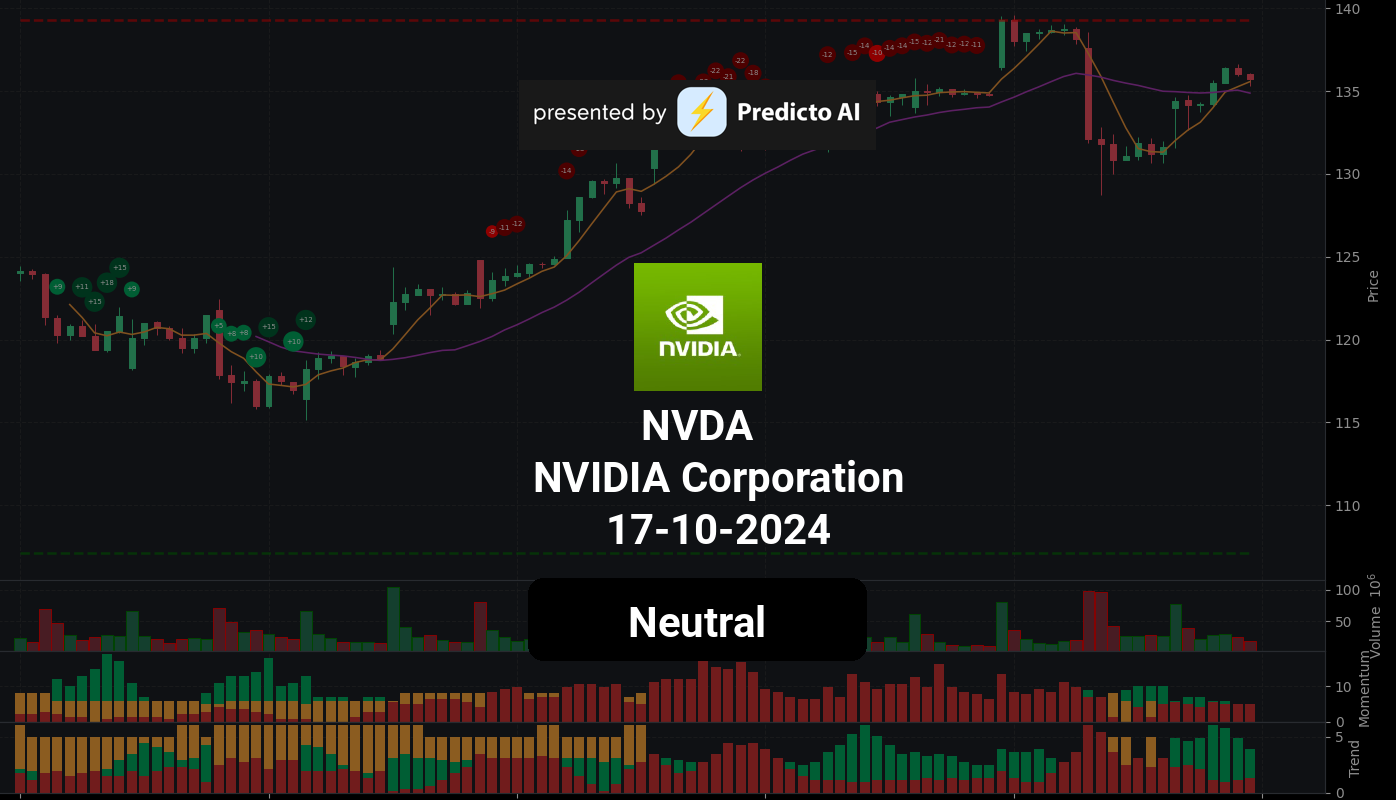
NVIDIA Corporation (NVDA) presents a complex investment landscape characterized by both bullish and cautious indicators. Currently, the stock is trading at a neutral price level, which suggests a period of consolidation. On the positive side, there are notable momentum indicators, including a Bullish Divergence on the WaveTrend, indicating a potential reversal in price direction. This could signal an opportunity for investors looking for upward movement.
However, caution is warranted as the stock is closer to resistance levels, which may limit further price appreciation in the short term. The trend indicators are largely positive, with the price consistently above the 50-day and 200-day EMA, reinforcing a bullish trend. Additionally, the Supertrend indicator confirms this bullish sentiment, as the price remains above the Supertrend line.
Despite these positive trends, there are some negative indicators to consider. The On-Balance Volume (OBV) is decreasing, which may suggest weakening buying pressure. Furthermore, the proximity to resistance levels raises concerns about the sustainability of the current uptrend.
Overall, while NVDA shows strong bullish trends and potential for upward movement, the decreasing OBV and position near resistance indicate that investors should proceed with caution. A hold recommendation may be prudent at this stage, allowing for further observation of market conditions and momentum shifts before making any significant investment decisions.
NVDA Fundamental Analysis
NVDA’s recent financial performance presents a compelling case for investment, characterized by strong profitability and growth potential. The company reported a remarkable net income of $16.60 billion for the most recent period, showcasing its robust earnings capabilities. Year-over-year net income growth further reinforces the positive outlook for future performance.
The company’s operating margin stands at an impressive 100.00%, indicating exceptional operational efficiency and effective cost management. Additionally, a net profit margin of 55.26% highlights NVDA’s strong ability to generate profits after accounting for all expenses. However, it is important to note that the average net debt of $3.71 billion requires further scrutiny to assess its impact on financial flexibility.
With a debt-to-equity ratio of 0.30, NVDA maintains a moderate level of leverage that appears manageable given its strong profitability. Conversely, the current ratio of 0.67 raises potential liquidity concerns, suggesting challenges in meeting short-term obligations. Furthermore, a cash to total assets ratio of 0.10 indicates limited financial flexibility, making the company somewhat vulnerable to economic fluctuations.
In terms of valuation, NVDA’s forward P/E ratio of 33.51 suggests that the stock is priced for growth, which may be justified by the company’s strong earnings growth of 168.00% and revenue growth of 122.40%. However, the price-to-sales ratio of 34.57 raises questions about potential overvaluation relative to sales.
The company’s growth and profitability metrics are equally impressive, with a revenue growth rate of 15.34% year-over-year indicating strong demand for its products and services. High profit margins further demonstrate NVDA’s efficiency in generating profits. However, the average dilution earnings of $16.60 billion could impact earnings per share if not managed effectively.
From a shareholder perspective, NVDA shows positive signs with a net cash from financing of $3.05 billion, indicating capital raising for growth or debt reduction. The company has also engaged in stock repurchases amounting to $4.89 billion, which can enhance earnings per share by reducing the number of shares outstanding. Nonetheless, the average ordinary shares outstanding of 24.63 billion raises potential dilution concerns if new shares are issued.
On the income statement front, NVDA reported a total revenue of $30.04 billion, reflecting strong sales performance. The net profit margin of 55.04% further underscores the company’s efficiency in profit generation.
Examining the balance sheet, the average total debt of $10.86 billion necessitates further analysis to understand its composition and terms. However, the average tangible book value of $36.60 billion indicates a solid net worth after liabilities. The current ratio of 0.67 again points to potential liquidity challenges.
In terms of cash flow, NVDA’s average capital expenditures of $1.25 billion suggest ongoing investment in growth and expansion. The company also boasts a positive free cash flow of $33.73 billion, indicating ample cash available for investments, debt reduction, or dividends.
Overall, NVDA demonstrates strong financial performance, growth potential, and profitability, despite some concerns regarding liquidity and debt levels. The positive indicators significantly outweigh the negatives, leading to a strong buy recommendation for investors considering this stock.
Financial Health
🟢 Net Income for the most recent period was $16.60 billion, indicating strong profitability.
🟢 Year-over-year net income increased, which is a positive sign for future performance.
🟢 Operating Margin of 100.00% suggests exceptional operational efficiency and cost control.
🟢 Net Profit Margin of 55.26% reflects the company’s strong ability to generate profits after all expenses.
🔴 Average Net Debt of $3.71 billion warrants further investigation into its impact on financial flexibility.
🟢 Debt-to-Equity Ratio of 0.30 indicates a moderate level of leverage, which is manageable given the company’s profitability.
🔴 Current Ratio of 0.67 suggests potential liquidity risk, as the company may face challenges in meeting short-term obligations.
🔴 Cash to Total Assets Ratio of 0.10 indicates limited financial flexibility and vulnerability to economic shocks.
Valuation
🟢 Forward P/E ratio of 33.51 suggests that the stock is priced for growth, but it may be justified given the strong earnings growth.
🔴 Price-to-Sales Ratio of 34.57 indicates potential overvaluation relative to sales.
🟢 Earnings Growth of 168.00% and Revenue Growth of 122.40% indicate strong growth potential, which may support higher valuations.
Growth and Profitability
🟢 Revenue Growth of 15.34% year-over-year indicates strong demand for products and services.
🟢 High profit margins demonstrate the company’s ability to generate profits efficiently.
🟢 Operating Margins of 62.06% reflect strong operational efficiency.
🔴 Average Dilution Earnings of $16.60 billion may impact earnings per share if not managed properly.
Shareholder Information
🟢 Positive net cash from financing of $3.05 billion indicates that the company is raising capital for growth or debt reduction.
🟢 Stock Repurchases of $4.89 billion can be a positive signal as it reduces the number of shares outstanding, potentially boosting EPS.
🔴 Average Ordinary Shares Outstanding of 24.63 billion indicates potential dilution concerns if shares are issued.
Income Statement
🟢 Total Revenue for the most recent period was $30.04 billion, showing strong sales performance.
🟢 Net Profit Margin of 55.04% reflects the company’s ability to generate profits efficiently.
Balance Sheet
🔴 Average Total Debt of $10.86 billion requires further analysis to understand its composition and terms.
🟢 Average Tangible Book Value of $36.60 billion indicates a solid net worth after liabilities.
🔴 Current Ratio of 0.67 suggests potential liquidity challenges.
Cashflow
🟢 Average Capital Expenditures of $1.25 billion suggest investment in growth and expansion.
🟢 Positive Free Cash Flow of $33.73 billion indicates that the company has cash available for investments, debt reduction, or dividends.
Overall, the company shows strong financial performance, growth potential, and profitability, despite some concerns regarding liquidity and debt levels. The positive indicators outweigh the negatives, leading to a strong buy recommendation.
NVDA News Analysis
Recent news surrounding Nvidia (NVDA) presents a largely positive outlook for investors, particularly in the context of the AI chip market and strategic partnerships.
Summary of NVDA news indicates a strong momentum in the AI sector, with TSMC reporting better-than-expected profits, which bodes well for Nvidia’s supply chain and demand for its products. Additionally, the company’s involvement in innovative projects, such as food delivery robots, showcases its expanding influence in various sectors. However, market fluctuations and external factors should be monitored closely.
🟢 TSMC’s profit beats estimates during an AI chip boom, indicating strong demand for chips, which is beneficial for Nvidia as a major customer.
🟢 The positive earnings report from TSMC suggests that Nvidia’s products are in high demand, reinforcing its market position.
🟢 Alok Sama’s insights on AI and market bubbles highlight the importance of strategic selling, but Nvidia’s fundamentals remain strong.
🟢 The discussion on AI in healthcare and cybersecurity trends indicates growing applications for Nvidia’s technology, potentially leading to increased revenue streams.
🟢 The article on AI energy consumption suggests that Nvidia could benefit from the rising demand for energy-efficient solutions in AI applications.
🟢 A forecasted buying opportunity in November for Nvidia indicates potential price appreciation, encouraging investors to consider entering or adding to their positions.
🟢 Nvidia stock rises after ASML earnings, suggesting resilience in the AI market despite broader market concerns.
🟢 The partnership with a robot maker for Uber Eats demonstrates Nvidia’s commitment to innovation and diversification in its business model.
🟢 The analysis of the ASML chip crash as an opportunity suggests that Nvidia and other AI stocks may rebound, indicating a favorable long-term outlook.
NVDA Holders Analysis
The financial health of NVDA shows a mixed outlook, with strong institutional backing but some caution warranted due to insider selling trends.
🟢 NVDA has a **high institutional ownership** at **66.76%**, indicating significant interest from large investors. This is a positive sign as it reflects confidence in the company’s future performance.
🟡 The **insider ownership** is relatively low at **4.29%**, which may suggest less alignment of interests between management and shareholders. However, the number of institutional holders at **5813** indicates a diversified ownership structure.
🟡 Recent **insider transactions** show a mix of sales and purchases, with a notable amount of selling in the past few months. This could indicate some executives are cashing out, but it is essential to note that many of these transactions are likely pre-planned.
🟢 Major institutional holders like **Vanguard Group Inc.** and **Blackrock Inc.** have substantial stakes, which is a strong indicator of confidence in NVDA’s growth potential.
🔴 The **insider purchases** over the last six months are significantly lower than sales, with only **2.2%** of shares bought compared to **10.6%** sold. This trend raises some concerns about insider sentiment.
🔴 The stock has experienced some volatility, and while institutional interest remains high, the recent selling by insiders could lead to short-term fluctuations in stock price.
NVDA Analyst Ratings
The analyst ratings for NVDA are predominantly positive, with a significant number of analysts recommending either a buy or strong buy. In the last month, there have been 7 strong buy ratings, 14 buy ratings, 15 hold ratings, 1 sell rating, and 1 strong sell rating. This distribution reflects a strong bullish sentiment among analysts. 🟢
Recent upgrades from firms such as Goldman Sachs and UBS, which maintained their buy ratings, further bolster this positive outlook. The overall trend indicates that analysts are confident in NVDA’s performance, particularly given its strong position in the semiconductor industry and ongoing demand for AI technologies.
Looking ahead, the stock is expected to perform well over the next month, with a forecasted price increase of approximately 5-10%. This is supported by the current analyst sentiment and market conditions. However, investors should remain aware of potential market volatility.
NVDA Economic Analysis
Based on the US economic and market data:
🟢 The **unemployment rate** has increased slightly to **4.3%**, but this is still relatively low, indicating a stable labor market. A stable labor market supports consumer spending, which is beneficial for companies like NVIDIA that rely on consumer electronics and gaming.
🟢 **Retail sales** have shown a positive trend, increasing to **627,510**. This suggests that consumers are spending more, which can lead to higher demand for NVIDIA’s products, particularly in gaming and data centers.
🟢 The **GDP** growth rate remains strong at **5737.189**, indicating a robust economy. A growing economy typically supports higher corporate earnings, which is favorable for NVIDIA’s stock price.
🔴 The **CPI** remains high at **314.540**, indicating persistent inflation. This could lead to potential interest rate hikes by the Federal Reserve, which may negatively impact growth stocks like NVIDIA in the long term.
🟢 Despite the inflation concerns, NVIDIA’s strong fundamentals, including a **profit margin of 55%** and a **trailing PE ratio of 63.72**, suggest that the company is well-positioned to weather economic fluctuations.
In summary, while there are some inflationary pressures, the overall economic indicators are supportive of NVIDIA’s growth trajectory. The combination of a stable labor market, increasing retail sales, and strong GDP growth suggests a positive outlook for NVIDIA’s stock price over the next month. I anticipate a price target range of **140 to 150** within the next month, reflecting a potential upside from the current price of **135.72**.
Disclaimer
Investors may consider the AI predictions and news summaries as one factor in their investment decisions alongside their own research and risk tolerance.


