
SYM Stock Analysis: A Mixed Outlook for Investors
🔴 Recommendation: SYM stock is currently rated as a strong buy, but investors should approach with caution due to conflicting indicators and market conditions.
📈 Key Highlights:
Momentum Indicators: Several indicators suggest that SYM may be oversold, presenting potential buying opportunities. The Money Flow Index (MFI) and Stochastic RSI show bullish divergences, while the WaveTrend indicator hints at a possible bottom.
Financial Health: Despite a negative net income of $-2,488 million, the company exhibits strong liquidity with a current ratio of 5.29 and a cash to total assets ratio of 0.43.
Growth Potential: Total revenue for the most recent period was $491,862 million, with a year-over-year growth of 15.92%, indicating strong growth potential.
⚠️ Caution Flags:
Bearish Trends: The stock has experienced a price breakdown below the lower band on high volume, and both the 50-day and 200-day EMAs indicate a strengthening bearish trend.
Valuation Concerns: The forward P/E ratio of 64.06 and a price-to-sales ratio of 8.44 suggest potential overvaluation, raising concerns about the stock’s pricing relative to its earnings and revenue.
As we delve deeper into the analysis, we will explore the price trends, detailed indicators, financial health, valuation metrics, and more to provide a comprehensive view of SYM’s current standing and future prospects. Stay tuned for an in-depth breakdown! 👇
SYM Price Analysis
| Positive Momentum Signals | Negative Momentum Signals | Hold Momentum Signals |
|---|---|---|
|
|
| Positive Trend Signals | Negative Trend Signals | Hold Trend Signals |
|---|---|---|
|
|
SYM stock presents a complex picture for investors, characterized by both positive and negative indicators. Currently, the stock is rated as a strong buy, suggesting potential upside despite the underlying challenges.
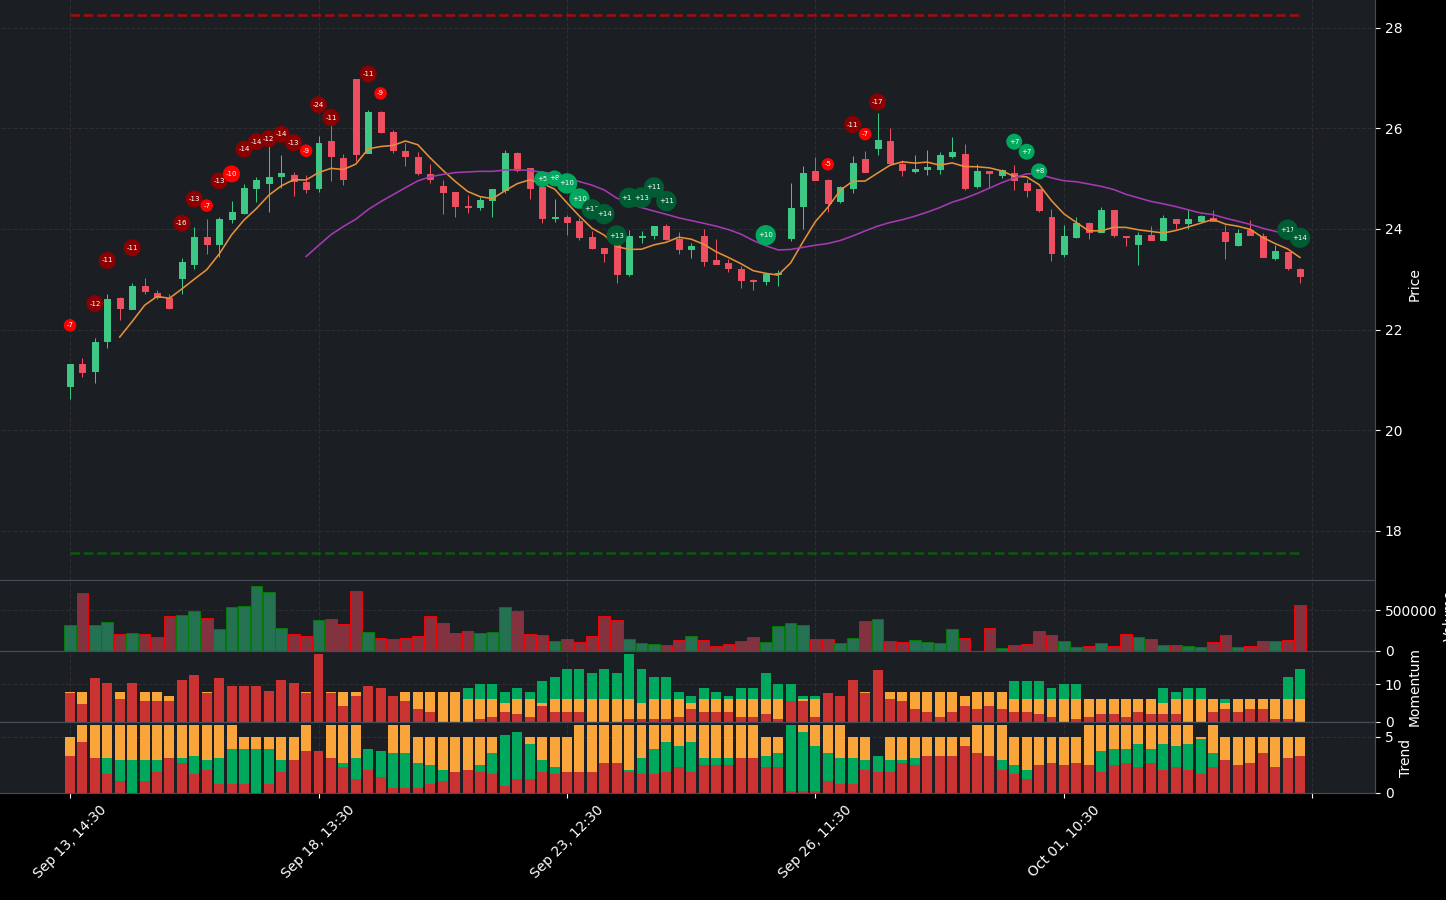
On the positive side, several momentum indicators signal that SYM may be oversold. The price is touching or outside the lower band, indicating a potential buying opportunity. Additionally, the Money Flow Index (MFI) shows a bullish divergence, while the Stochastic RSI is also in an oversold condition with a bullish divergence noted. Furthermore, the WaveTrend indicator suggests that the stock is oversold, hinting at a potential bottom.
However, caution is warranted due to significant negative trend indicators. The stock has experienced a price breakdown below the lower band on high volume, which could indicate the start of a new bearish trend. The On-Balance Volume (OBV) is decreasing, and both the 50-day and 200-day Exponential Moving Averages (EMAs) indicate a bearish trend that is strengthening. The Supertrend indicator also confirms this bearish sentiment, as the price remains below the Supertrend line.
In summary, while SYM stock shows some promising momentum indicators that suggest it may be oversold and a potential buying opportunity, the prevailing bearish trends and volume signals indicate that investors should proceed with caution. A hold or buy strategy may be appropriate, but it is essential to monitor the stock closely for any signs of a trend reversal or further deterioration in price action.
SYM Fundamental Analysis
SYM’s recent financial performance presents a mixed picture, characterized by both promising growth indicators and significant challenges.
On the positive side, the company reported a total revenue of $491,862 million, reflecting a robust year-over-year revenue growth of 15.92%. This suggests strong growth potential, which could be appealing to investors looking for upward momentum. Additionally, the company’s liquidity position is solid, as evidenced by a current ratio of 5.29 and a cash to total assets ratio of 0.43. These metrics indicate that SYM can comfortably cover its short-term liabilities and has a buffer for unexpected expenses.
However, the financial health of SYM is marred by several alarming trends. The most concerning is the negative net income of $-2,488 million, which raises significant red flags about the company’s profitability. Despite the year-over-year increase in net income, the negative net profit margin of -1.03% reflects ongoing challenges in generating profits after expenses. Furthermore, the high debt-to-equity ratio of 4.79 raises concerns about financial leverage and potential risks associated with high debt levels.
Valuation metrics also suggest potential overvaluation, with a forward P/E ratio of 64.06 and a price-to-sales ratio of 8.44. These figures indicate that the stock may be priced too high relative to its earnings and revenue, which could deter value-focused investors.
In terms of shareholder information, the average ordinary shares outstanding at 86,790,517 suggest potential dilution risks if new shares are issued. However, the absence of treasury shares indicates no buybacks, which could be seen as a positive for existing shareholders.
The company’s cash flow situation shows some promise, with average capital expenditures of $14,128 million indicating investment in growth and expansion. Additionally, a free cash flow of $115.88 million suggests some level of cash generation, which is a positive sign for operational sustainability.
In summary, while SYM exhibits strong revenue growth and a solid liquidity position, the high valuation metrics and negative net income raise significant concerns. The company is navigating a challenging landscape, and investors should proceed with caution. A thorough evaluation of SYM’s ability to address its financial challenges is essential before considering any investment.
Financial Health
🔴 Net Income for the most recent period was negative at $-2,488 million, indicating significant losses.
🟢 Year-over-year net income increased, which is a positive sign for future profitability.
🟢 Current Ratio of 5.29 indicates a strong liquidity position, suggesting the company can comfortably cover its short-term liabilities.
🟢 Cash to Total Assets Ratio of 0.43 reflects a solid liquidity position, providing a buffer for unexpected expenses.
🔴 High Debt-to-Equity Ratio of 4.79 raises concerns about financial leverage and potential risk.
Valuation
🔴 Forward P/E ratio of 64.06 indicates potential overvaluation, suggesting that the stock may be priced too high relative to its earnings.
🔴 Price-to-Sales Ratio of 8.44 is also high, indicating potential overvaluation compared to revenue.
Growth and Profitability
🟢 Total Revenue for the most recent period was $491,862 million, with a year-over-year revenue growth of 15.92%, indicating strong growth potential.
🔴 Operating Margin of 100.00% suggests efficient operations, but the negative Net Profit Margin of -0.51% raises concerns about overall profitability.
🔴 Average Dilution Earnings of $-2,488 million indicates that share-based compensation has notably impacted earnings per share, potentially diluting value for existing shareholders.
Shareholder Information
🔴 Average Ordinary Shares Outstanding at 86,790,517 suggests potential dilution risks if new shares are issued.
🟢 Average Treasury Shares at 0 indicates no buybacks, which could be a positive sign for existing shareholders.
Income Statement
🔴 Negative Net Profit Margin of -1.03% reflects challenges in generating profits after expenses.
🟢 Operating Margin of 100.00% suggests efficient operations, but the overall profitability remains a concern due to the negative net profit margin.
Balance Sheet
🟢 Average Tangible Book Value of $199,673,800 million indicates a strong net worth after liabilities.
🔴 High debt levels indicated by the Debt-to-Equity ratio of 4.79 could pose risks to financial stability.
Cashflow
🟢 Average Capital Expenditures of $14,128 million suggest that the company is investing in growth and expansion.
🟢 Free Cash Flow of $115.88 million indicates some level of cash generation, which is a positive sign for operational sustainability.
Overall, while there are some positive indicators such as revenue growth and liquidity, the high valuation metrics and negative net income raise concerns. The company is in a challenging position, and investors should proceed with caution.
SYM News Analysis
SYM News: A mixed outlook for investors.
The news surrounding Symbotic Inc. (SYM) presents a mixed outlook for investors. While there are positive indicators regarding investor interest and market performance, there are also concerns about its overall performance and potential risks. Investors should weigh these factors carefully.
🟢 Investors are heavily searching for Symbotic Inc. (SYM), indicating strong interest in the stock. This could lead to increased trading volume and potential price appreciation.
🟢 SYM has surpassed market returns, suggesting that it is performing well compared to its peers. This positive performance can attract more investors.
🔴 However, there are discussions about whether SYM is one of the worst-performing stocks to buy on the dip, which raises concerns about its long-term viability.
🔴 Some analysts are questioning if SYM is a falling stock, which could deter potential investors.
🟢 Despite these concerns, there are articles highlighting SYM as a stock to consider for growth, indicating that some analysts still see potential in the company.
🟢 The overall sentiment from Zacks and other financial news outlets suggests that SYM is attracting investor attention, which could lead to further interest and potential price increases.
SYM Holders Analysis
The financial health of SYM is supported by strong institutional ownership and positive insider sentiment, indicating a favorable outlook for the next month.
🟢 SYM has a high insider ownership of 16.71%, which suggests that management’s interests are closely aligned with those of shareholders, a generally positive sign for investors.
🟢 The institutional ownership stands at 80.79%, with 322 institutions holding shares. This indicates significant interest from large investors, which often leads to increased stability and confidence in the stock.
🟡 Recent insider transactions show a mix of purchases and sales, but the overall sentiment remains positive, with more purchases than sales in the last six months.
🟢 The presence of major institutional holders like Softbank Group Corporation and Vanguard Group Inc. reflects strong institutional confidence in SYM’s future performance.
🟡 The stock has shown resilience in the face of market fluctuations, indicating a solid operational foundation.
🔴 However, the high institutional ownership could lead to increased volatility if large investors decide to sell, which is a risk to consider.
SYM Analyst Ratings
The analyst ratings for SYM show a mixed sentiment, with a notable number of sell recommendations recently. The latest downgrade from BWS Financial to sell indicates a cautious outlook.
🔴 In the past month, there have been 2 strong buy ratings, 9 buy ratings, 4 hold ratings, 1 sell rating, and no strong sell ratings. This distribution suggests a lack of strong bullish sentiment among analysts, especially with the recent downgrade.
🟡 Given the recent analyst actions and the overall mixed sentiment, it is likely that SYM may face challenges in the next month. The medium confidence level reflects the uncertainty in the market, but the presence of multiple buy ratings suggests that there may still be some potential for recovery. However, caution is advised as the sell recommendation could indicate underlying issues that may affect performance.
SYM Economic Analysis
Based on the US economic and market data:
🔴 The unemployment rate has increased to 4.3%, up from 4.1% in the previous month, indicating a potential slowdown in the labor market which could negatively impact consumer spending and, consequently, SYM’s revenue growth.
🟡 Retail sales have shown a slight increase to 627,510, but this is not a significant jump, suggesting that consumer demand is stabilizing rather than accelerating. This could lead to cautious spending behavior among consumers.
🟢 The GDP growth remains relatively stable at 5737.189, indicating that the economy is not in a recession, which is a positive sign for industrial companies like Symbotic.
🔴 The CPI data shows inflationary pressures, which could lead to increased costs for Symbotic’s operations, potentially squeezing margins.
🟡 The current price of SYM at 23.06 is significantly lower than its 52-week high of 59.82, indicating that the stock has room for recovery but is currently under pressure.
Overall, while there are some positive indicators, the increase in unemployment and inflationary pressures suggest a cautious outlook for SYM over the next month. The stock may remain volatile, and investors should be prepared for fluctuations.
Disclaimer
Investors may consider the AI predictions and news summaries as one factor in their investment decisions alongside their own research and risk tolerance.


