TGT Stock Analysis: A Mixed Outlook Ahead!
🔴 Recommendation: Target Corporation (TGT) is currently facing a complex financial landscape, with a cautious sell recommendation as risks may outweigh potential rewards.
📈 Key Highlights:
Financial Health: Positive net income of $1.19 billion and a healthy current ratio of 2.80, indicating solid liquidity.
Valuation: Forward P/E ratio of 14.81 suggests potential undervaluation, making TGT appealing for long-term investors.
Growth: Strong earnings growth of 42.80% year-over-year, showcasing positive business performance.
⚠️ Caution Flags:
Debt Concerns: High debt-to-equity ratio of 1.46 raises financial risk concerns.
Retail Challenges: Ongoing legal issues and concerns over retail theft could impact operational performance.
Market Sentiment: Mixed analyst ratings with a predominance of hold recommendations indicate uncertainty in the stock’s short-term trajectory.
As we delve deeper into the analysis, we will explore the price trends, technical indicators, financial health, valuation metrics, and the broader market context affecting TGT’s performance. Stay tuned for a comprehensive breakdown of what lies ahead for Target Corporation! 👇
TGT Price Analysis

| Positive Momentum Signals | Negative Momentum Signals | Hold Momentum Signals |
|---|---|---|
|
|
|
| Positive Trend Signals | Negative Trend Signals | Hold Trend Signals |
|---|---|---|
|
|
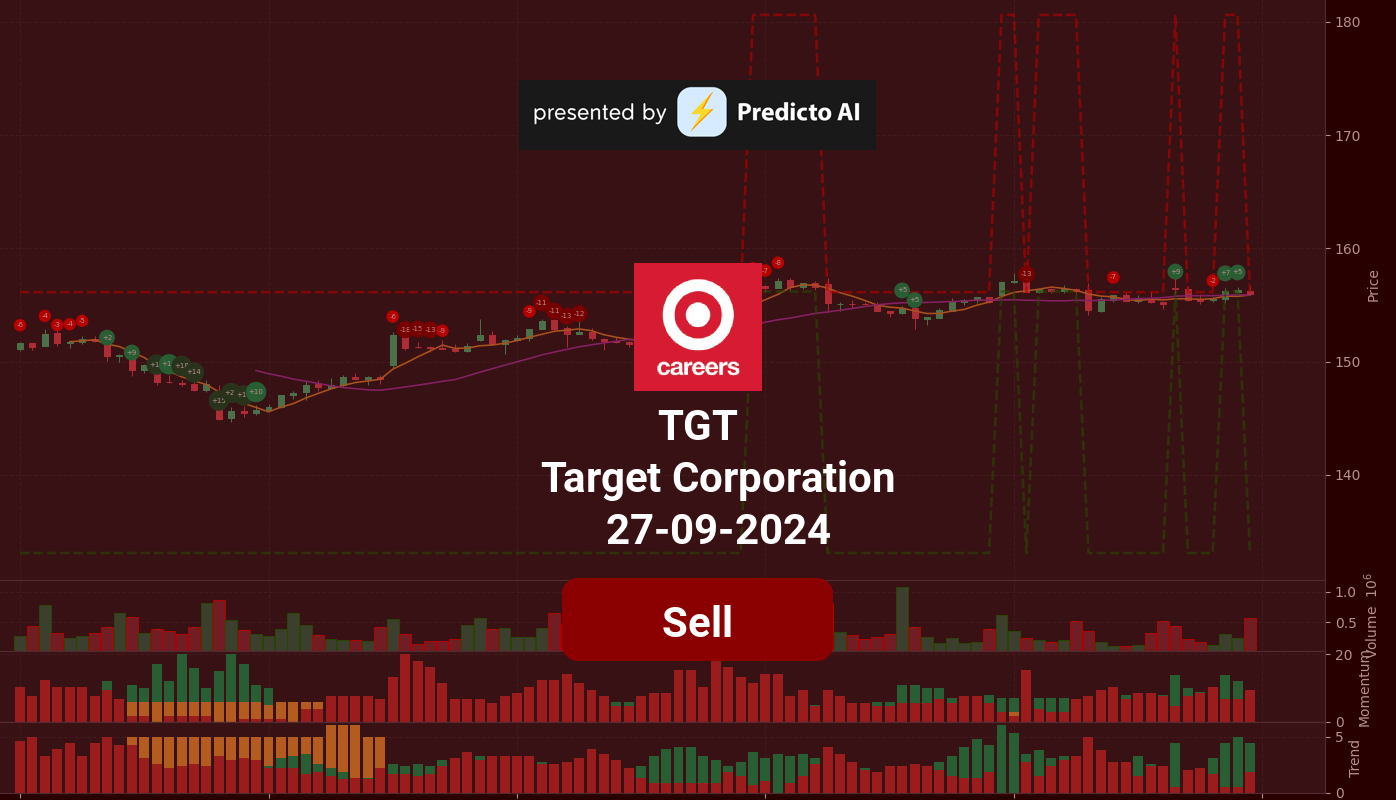
TGT stock presents a complex financial picture, characterized by both positive and negative indicators. On the positive side, TGT shows a potential for a bullish reversal as indicated by the WaveTrend’s bullish divergence. Additionally, the stock is currently trading above the 50-day and 200-day EMAs, which suggests a strengthening bullish trend. The price is also above the middle band of its Bollinger Bands, indicating an uptrend, although caution is warranted due to potential overbought conditions. Furthermore, the MACD has shown a positive histogram crossover, reinforcing the bullish sentiment.
However, there are significant concerns that investors should consider. The stock is closer to resistance, which could limit upside potential. The On-Balance Volume (OBV) is decreasing, indicating that the buying pressure is waning, and high volume is also decreasing, which could signal a lack of conviction in the current price levels. The Supertrend indicator is bearish, with the price trading below it, suggesting a bearish trend in the short term.
Given these mixed signals, investors should approach TGT with caution. While there are some bullish indicators, the proximity to resistance and bearish trends in volume and Supertrend suggest that the stock may face challenges in maintaining its upward momentum. A sell recommendation is prudent at this time, as the risks may outweigh the potential rewards until clearer bullish signals emerge.
TGT Fundamental Analysis
TGT’s recent financial performance presents a mixed picture, but overall, it leans towards a positive outlook for investors. The company reported a net income of $1.19 billion for the most recent period, indicating profitability and a year-over-year increase in net income, which is generally a favorable sign for investors. However, there are some concerns regarding its financial health, particularly with a negative net interest income of -$110 million, suggesting that TGT is paying more in interest on its debts than it is earning on its assets. Additionally, the debt-to-equity ratio stands at a high 1.46, raising questions about the company’s financial risk profile and its ability to withstand economic downturns.
On a positive note, TGT’s current ratio of 2.80 indicates a healthy liquidity position, suggesting that the company should be able to comfortably cover its short-term liabilities.
In terms of valuation, TGT appears to be potentially undervalued with a forward P/E ratio of 14.81 and a price-to-sales ratio of 0.67. These metrics make the stock appealing compared to its sales and suggest that there may be room for future price appreciation. Furthermore, the company has demonstrated strong earnings growth of 42.80%, which is a positive indicator for future profitability.
When examining growth and profitability, TGT has shown a revenue growth of 3.75% year-over-year, indicating moderate growth, although the net profit margin of 4.68% is relatively low, which could be a concern for investors. On the other hand, the operating margin of 98.31% reflects efficient operations and good cost control, which is a positive sign for the company’s profitability.
From a shareholder perspective, TGT has positive net cash flow from financing activities at $2.74 billion, indicating that the company is raising capital, which could be used for growth or debt reduction. Additionally, share repurchases of $2.64 billion can signal confidence in the company’s future prospects, as it reduces the number of shares outstanding and may boost earnings per share (EPS).
Looking at the income statement, TGT reported total revenue of $25.45 billion, indicating a solid revenue base. However, the year-over-year revenue growth of 2.70% is modest, suggesting that while the company is growing, it may not be at an aggressive pace.
On the balance sheet, the average net debt of $13.01 billion warrants further investigation into its impact on the company’s financial flexibility and ability to service debt obligations. The cash to total assets ratio of 0.05 indicates limited financial flexibility and a higher vulnerability to economic shocks. However, the average tangible book value of $13.11 billion represents the net worth of the company after deducting liabilities from assets, which is a positive sign.
In terms of cash flow, TGT has an average free cash flow of $3.74 billion, indicating that the company has cash available for investments, debt reduction, or dividends, which is a positive indicator for financial health. The average capital expenditures of $4.13 billion suggest that the company is investing in growth and expansion, which is a good sign for future performance.
Overall, while there are some concerns regarding profitability and debt levels, TGT’s strong revenue base, efficient operations, and positive cash flow indicate potential for growth, making it a candidate for a buy recommendation. Investors should consider these factors when evaluating TGT as a potential investment opportunity.
Financial Health
🟢 Net Income for the most recent period was positive at $1.19 billion, indicating profitability.
🟢 Year-over-year net income increased, which is generally a positive sign for investors.
🔴 Net Interest Income was negative at -$110 million, suggesting the company is paying more in interest on its debts than it is earning on its assets.
🔴 The Debt-to-Equity Ratio is high at 1.46, raising concerns about the company’s financial risk profile and its ability to withstand economic downturns.
🟢 Current Ratio of 2.80 indicates a healthy liquidity position, suggesting the company should be able to cover its short-term liabilities comfortably.
Valuation
🟢 Forward P/E ratio of 14.81 suggests potential future undervaluation, which could be attractive for investors.
🟢 Price-to-Sales Ratio of 0.67 indicates potential undervaluation, making the stock appealing compared to its sales.
🟢 Strong earnings growth of 42.80% indicates positive business performance, which is a good sign for future profitability.
Growth and Profitability
🟢 Revenue Growth of 3.75% year-over-year suggests moderate growth, which could still be positive for the stock price.
🔴 Net Profit Margin of 4.68% is relatively low, which could be a concern for investors regarding profitability.
🟢 Operating Margin of 98.31% suggests efficient operations and good cost control, which is a positive indicator for the company’s profitability.
Shareholder Information
🟢 Positive net cash flow from financing activities at $2.74 billion indicates the company is raising capital, which could be used for growth or debt reduction.
🟢 Share repurchases of $2.64 billion can be a positive signal as it reduces the number of shares outstanding and may boost earnings per share (EPS).
Income Statement
🟢 Total revenue for the most recent period was $25.45 billion, indicating a solid revenue base.
🔴 Year-over-year revenue growth of 2.70% is modest, suggesting that while the company is growing, it may not be at an aggressive pace.
Balance Sheet
🔴 Average Net Debt of $13.01 billion warrants further investigation into its impact on the company’s financial flexibility and ability to service debt obligations.
🔴 Cash to Total Assets Ratio of 0.05 indicates limited financial flexibility and a higher vulnerability to economic shocks.
🟢 Average Tangible Book Value of $13.11 billion represents the net worth of the company after deducting liabilities from assets, which is a positive sign.
Cashflow
🟢 Average Free Cash Flow of $3.74 billion indicates that the company has cash available for investments, debt reduction, or dividends, which is a positive indicator for financial health.
🟢 Average Capital Expenditures of $4.13 billion suggests the company is investing in growth and expansion, which is a good sign for future performance.
Overall, while there are some concerns regarding profitability and debt levels, the company’s strong revenue base, efficient operations, and positive cash flow indicate potential for growth, making it a candidate for a buy recommendation.
TGT News Analysis
Target Corporation (TGT) faces a challenging environment with legal issues and concerns over retail theft, but promotional efforts may help mitigate some negative impacts.
Summary of TGT news indicates a mixed outlook for investors. The ongoing lawsuit regarding ‘clean’ labeling and the challenges posed by retail theft are significant concerns. However, the upcoming promotional events could drive sales and improve customer engagement.
🔴 Target has failed to convince a federal judge to dismiss a lawsuit over its ‘clean’ labeling practices, which could lead to reputational damage and potential financial liabilities.
🔴 The stock has only gained 6% over the past three months, raising questions about its performance and whether investors should hold or sell.
🔴 Concerns about retail theft persist, as highlighted by the CEO’s comments on locked products, indicating ongoing operational challenges.
🟢 On a positive note, Target is preparing for its Circle Week event, which promises discounts of up to 50%, potentially boosting sales and customer traffic.
🔴 Additionally, the competitive landscape is intensifying, with other retailers, such as Whole Foods, slashing prices to attract customers, which could pressure Target’s market share.
TGT Holders Analysis
The financial health of TGT shows a mixed outlook, with both positive and negative indicators that suggest a cautious approach for the next month.
🟢 TGT has a high institutional ownership at **82.89%**, indicating strong interest from large investors, which typically provides stability and confidence in the stock’s performance. This level of institutional backing can help buffer against volatility.
🔴 However, the **0.22% insider ownership** is very low, which may indicate a lack of confidence from company management or a high degree of external control. This could be a red flag for potential investors, as it suggests that insiders may not have significant skin in the game.
🟡 The number of institutional holders is substantial at **2465**, which reflects a diversified ownership structure. This can be a positive sign, as it indicates that many institutions are interested in TGT, potentially leading to more stable stock performance.
🔴 Recent insider transactions show a higher number of sales compared to purchases, which could signal a lack of confidence among insiders regarding the company’s short-term prospects. This trend may raise concerns for potential investors.
🟡 The overall market conditions and consumer sentiment are currently mixed, which could impact TGT’s performance in the near term. Analysts are cautious, and while there are some positive indicators, the overall sentiment is not overwhelmingly bullish.
TGT Analyst Ratings
The analyst ratings for TGT show a mixed sentiment, with a notable number of hold ratings dominating the recommendations. In the past month, there have been 2 strong buy ratings, 2 buy ratings, 18 hold ratings, 3 sell ratings, and 1 strong sell rating. This indicates a cautious outlook among analysts. 🔴
Recent upgrades from firms like Melius Research and Citigroup suggest some optimism, but the overall distribution of ratings leans towards a neutral stance. The presence of 18 hold ratings indicates that many analysts are not confident in a significant upward movement in the stock price in the short term.
🟡 Given the mixed analyst sentiment and the predominance of hold ratings, it is likely that TGT will experience limited movement in the next month, with potential fluctuations around current levels. The medium confidence level reflects the uncertainty in the market and the need for investors to remain vigilant.
TGT Economic Analysis
Based on the US economic and market data:
🔴 The unemployment rate has increased to 4.3%, up from 4.1% in the previous month, indicating a potential softening in the labor market. This could lead to reduced consumer spending, which is critical for retail companies like Target.
🟡 Retail sales have shown a modest increase to 627,510, but this is not significantly higher than the previous month, suggesting that consumer demand is stable but not growing robustly. This could limit Target’s revenue growth in the near term.
🟢 The GDP growth rate remains relatively stable, which is a positive sign for overall economic health. A stable GDP can support consumer confidence and spending, which is beneficial for Target’s sales.
🔴 The CPI data indicates inflationary pressures, which could lead to increased costs for Target. If these costs are passed on to consumers, it may affect sales negatively.
Overall, while there are some positive indicators, the increase in unemployment and modest retail sales growth suggest a cautious outlook for Target in the coming month. The stock may experience volatility as investors react to these mixed signals.
Disclaimer
Investors may consider the AI predictions and news summaries as one factor in their investment decisions alongside their own research and risk tolerance.


