Visa (V) Stock Analysis: A Mixed Outlook Ahead!
🔴 Recommendation: Visa is presenting a complex investment landscape with both bullish and bearish signals, suggesting that investors should tread carefully.
📈 Key Highlights:
Financial Health: Strong net income of $4.872 billion and impressive operating margins of 130.90% indicate robust profitability.
Growth Potential: Earnings growth of 16.90% and positive free cash flow of $14.697 billion highlight the company’s strong growth momentum.
Institutional Support: High institutional ownership at 89.73% reflects confidence from large investors, while recent price target adjustments by analysts suggest optimism about future performance.
⚠️ Caution Flags:
Debt Levels: Average net debt of $6.304 billion and a concerning debt-to-equity ratio of -3.52 raise questions about financial flexibility.
Valuation Concerns: A high price-to-sales ratio of 16.20 may indicate potential overvaluation compared to industry peers.
As we delve deeper into the analysis, we will explore the price trends, technical indicators, financial health, valuation metrics, and more to provide a comprehensive view of Visa’s stock performance and outlook. Stay tuned for the detailed breakdown below! 👇
V Price Analysis
| Positive Momentum Signals | Negative Momentum Signals | Hold Momentum Signals |
|---|---|---|
|
|
| Positive Trend Signals | Negative Trend Signals | Hold Trend Signals |
|---|---|---|
|
|
|
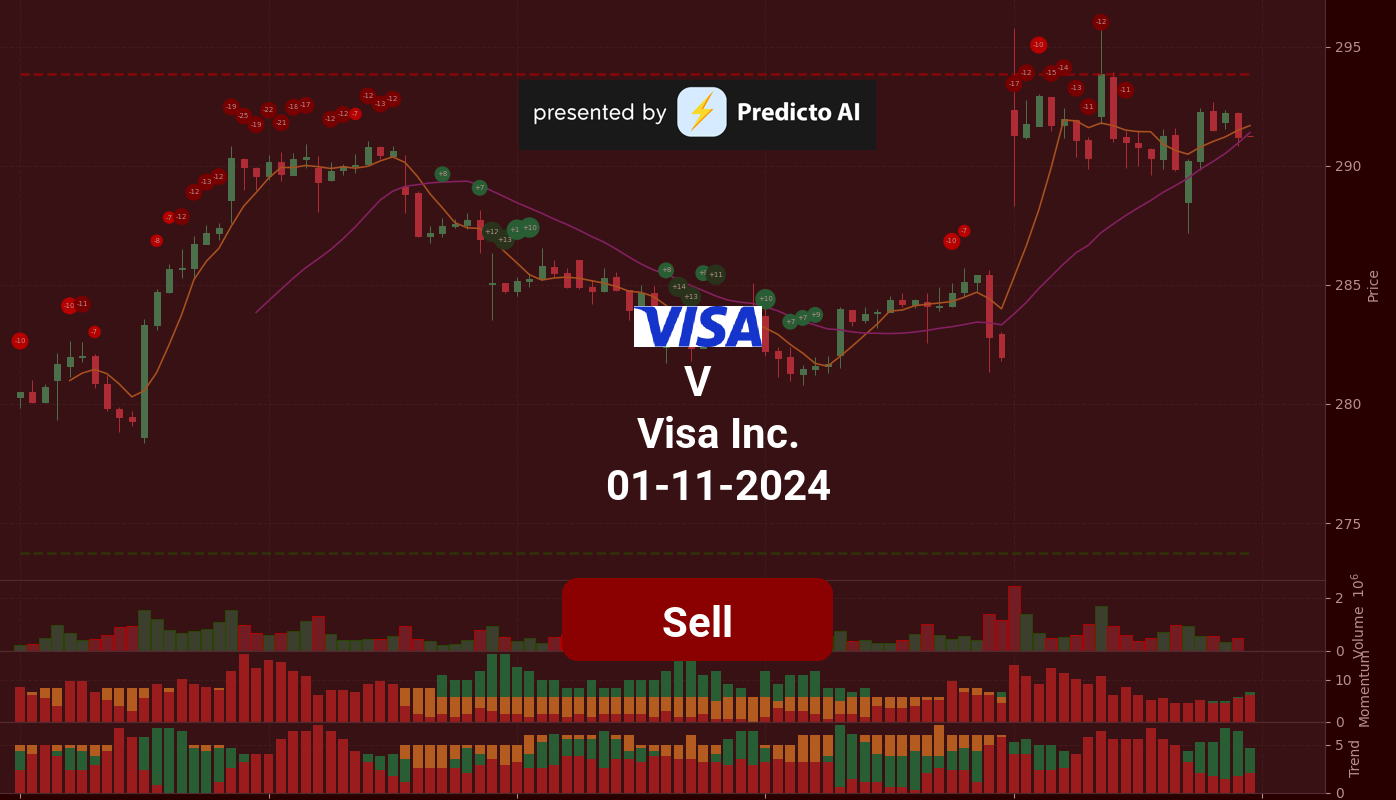
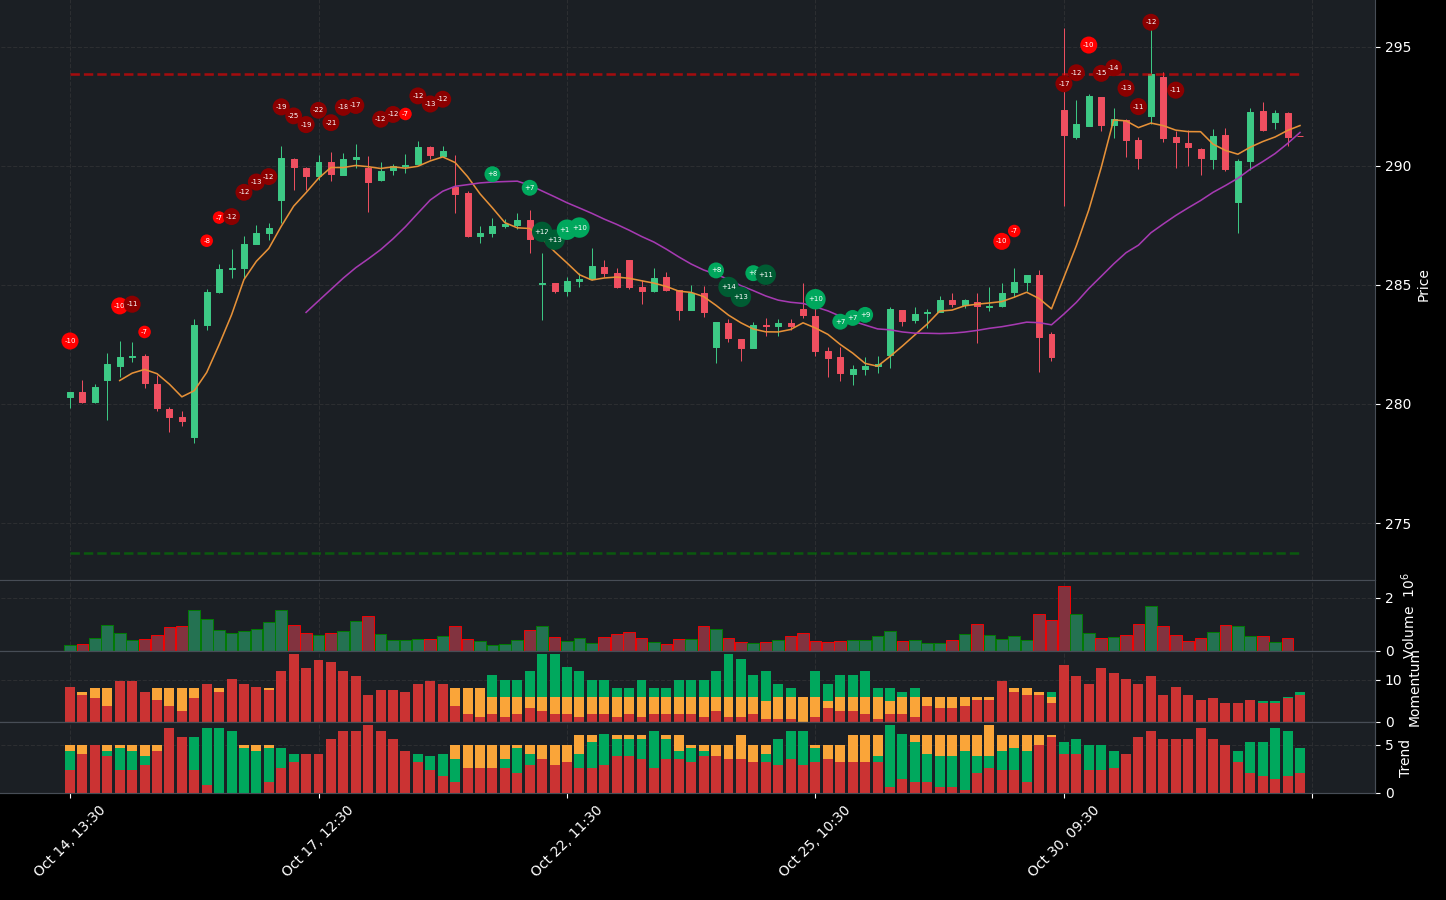
V stock presents a complex picture for investors, characterized by both bullish and bearish signals. On the positive side, the stock is currently trading above both the 50-day EMA and the 200-day EMA, indicating a bullish trend that is strengthening. Additionally, the Supertrend indicator supports this bullish outlook, as the price remains above the Supertrend line.
However, caution is warranted due to several negative momentum indicators. The WaveTrend indicator has issued a sell signal with a confirmed crossover, suggesting potential downward pressure. Furthermore, the stock’s position is closer to resistance, which may limit upside potential in the near term. The price is also below the Middle Band while remaining above the Lower Band, indicating a downtrend but with caution advised due to possible oversold conditions.
Given these mixed signals, investors should approach V stock with care. While the long-term trend appears bullish, the recent momentum indicators and proximity to resistance suggest that a sell position may be prudent at this time. Monitoring for clearer signals of a trend reversal or confirmation of bullish momentum will be essential for future investment decisions.
V Fundamental Analysis
V’s recent financial performance presents a compelling case for investment, characterized by strong profitability and growth potential, despite some concerns regarding its debt levels and valuation metrics.
The company reported a positive net income of $4.872 billion for the most recent period, indicating robust profitability. Furthermore, the year-over-year increase in net income is a positive sign for future performance. V’s operating margin stands at an impressive 130.90%, reflecting efficient operations and excellent cost control, while a net profit margin of 54.74% underscores its strong ability to generate profits after all expenses.
However, there are some cautionary notes regarding V’s financial health. The average net debt is high at $6.304 billion, which necessitates further investigation into its impact on financial flexibility. Additionally, a debt-to-equity ratio of -3.52 suggests a moderate level of leverage that may be sustainable but requires careful monitoring. The current ratio of 6.01 indicates a healthy liquidity position, suggesting that the company can comfortably cover its short-term liabilities. On the downside, the cash to total assets ratio of 0.16 indicates limited financial flexibility and potential vulnerability to economic shocks.
In terms of valuation, V’s forward P/E ratio of 23.04 suggests a reasonable valuation given its growth prospects. However, the price-to-sales ratio of 16.20 is relatively high, indicating potential overvaluation compared to industry peers.
When examining growth and profitability, V shows strong earnings growth of 16.90%, indicating solid growth momentum. Revenue growth of 1.42% suggests moderate growth, which could still positively impact the stock price. The company also demonstrates high profit margins, showcasing its ability to generate profits efficiently. Notably, positive free cash flow of $14.697 billion indicates that V has cash available for investments, debt reduction, or dividends.
From a shareholder perspective, V has engaged in stock repurchases totaling $10.12 billion, which can be a positive signal as it reduces the number of shares outstanding and may boost earnings per share (EPS). The average ordinary shares outstanding at 2.04 billion indicates a stable shareholder base.
Looking at the income statement, V reported total revenue of $8.9 billion, demonstrating solid sales performance. The operating margin of 66.12% and net profit margin of 54.72% further reflect the company’s operational efficiency and profitability.
On the balance sheet, the average total debt of $20.586 billion requires further analysis to understand its composition and terms. Additionally, the average tangible book value of -$5.851 billion indicates a negative net worth after deducting liabilities from assets, which is concerning.
In terms of cash flow, the average capital expenditures of $867.5 million suggest that the company is investing in growth and expansion. Positive net cash from financing of $4.17 billion indicates that V is raising capital, which could be used for growth or debt reduction.
Overall, V demonstrates strong profitability and growth potential, with positive indicators outweighing the negatives. The recommendation is to buy, as the company’s solid financial health and growth prospects present a favorable investment opportunity.
Financial Health
🟢 Net Income for the most recent period was positive at $4.872 billion, indicating strong profitability.
🟢 Year-over-year net income increased, which is a positive sign for future performance.
🟢 Operating Margin of 130.90% suggests efficient operations and excellent cost control.
🟢 Net Profit Margin of 54.74% reflects the company’s strong ability to generate profits after all expenses.
🔴 Average Net Debt is high at $6.304 billion, which warrants further investigation into its impact on financial flexibility.
🔴 Debt-to-Equity Ratio of -3.52 suggests a moderate level of leverage, which may be sustainable but requires careful monitoring.
🟢 Current Ratio of 6.01 indicates a healthy liquidity position, suggesting the company can comfortably cover its short-term liabilities.
🔴 Cash to Total Assets Ratio of 0.16 indicates limited financial flexibility and potential vulnerability to economic shocks.
Valuation
🟢 Forward P/E ratio of 23.04 suggests reasonable valuation given the company’s growth prospects.
🔴 Price-to-Sales Ratio of 16.20 is relatively high, indicating potential overvaluation compared to industry peers.
Growth and Profitability
🟢 Earnings Growth of 16.90% indicates strong growth momentum.
🟢 Revenue Growth of 1.42% suggests moderate growth, which could still be positive for the stock price.
🟢 High profit margins demonstrate the company’s ability to generate profits efficiently.
🟢 Positive free cash flow of $14.697 billion indicates the company has cash available for investments, debt reduction, or dividends.
Shareholder Information
🟢 Stock Repurchases of $10.12 billion can be a positive signal as it reduces the number of shares outstanding and may boost earnings per share (EPS).
🟢 Average Ordinary Shares Outstanding at 2.04 billion indicates a stable shareholder base.
Income Statement
🟢 Total Revenue for the most recent period was $8.9 billion, showing solid sales performance.
🟢 Operating Margin of 66.12% suggests strong operational efficiency.
🟢 Net Profit Margin of 54.72% reflects the company’s ability to generate profits after expenses.
Balance Sheet
🔴 Average Total Debt of $20.586 billion requires further analysis to understand its composition and terms.
🔴 Average Tangible Book Value of -$5.851 billion indicates a negative net worth after deducting liabilities from assets, which is concerning.
Cashflow
🟢 Average Capital Expenditures of $867.5 million suggests the company is investing in growth and expansion.
🟢 Positive Net Cash from Financing of $4.17 billion indicates the company is raising capital, which could be used for growth or debt reduction.
Overall, the company shows strong profitability and growth potential, despite some concerns regarding debt levels and valuation metrics. The positive indicators outweigh the negatives, leading to a recommendation to buy.
V News Analysis
Visa (V) is showing a positive outlook with multiple analysts adjusting price targets upwards, indicating confidence in the company’s growth potential. However, the mixed ratings suggest caution.
Summary of Visa news indicates a generally positive sentiment for investors. The deployment of AI use cases and upward adjustments in price targets by various analysts are strong indicators of growth. However, the mixed ratings from different firms suggest that investors should remain cautious and consider their risk tolerance.
🟢 Visa has deployed hundreds of AI use cases, showcasing its commitment to innovation and efficiency. This strategic move could enhance operational capabilities and customer experience, potentially leading to increased revenue.
🔴 The unemployment rate holding at 4.1% may indicate economic stagnation, which could affect consumer spending and, consequently, Visa’s transaction volumes.
🔴 Mizuho has adjusted Visa’s price target to $292 from $279 while maintaining a neutral rating. This suggests a cautious outlook, indicating that while there is potential for growth, it may not be as strong as previously thought.
🟢 CICC has raised Visa’s price target to $341 from $328.68 and maintains an outperform rating, reflecting confidence in Visa’s growth trajectory and market position.
🔴 Fubon Securities has adjusted Visa’s price target to $300 from $280 while keeping a neutral rating, indicating a more conservative approach to Visa’s valuation.
🟢 Argus has raised its price target on Visa to $330 from $295, which is a positive sign and suggests that analysts see potential for growth in the near future.
🔴 Mastercard’s Q3 earnings beat estimates, which could indicate increased competition in the payments sector. This may put pressure on Visa to maintain its market share and growth.
V Holders Analysis
The financial health of Visa Inc. (V) presents a mixed outlook for the next month. While there are strong institutional holdings, the low insider ownership and recent insider selling raise some concerns.
🟢 Visa has a **high institutional ownership** at **89.73%**, indicating strong interest from large investors, which typically supports stock stability and growth. Major holders like Vanguard and Blackrock show confidence in the company’s future.
🔴 The **insider ownership is very low at 0.57%**, suggesting a lack of confidence from company management or a high degree of external control. This could imply that insiders do not see immediate value in holding onto their shares.
🟡 Recent **insider transactions show a pattern of selling**, with several executives divesting shares. This could be a sign of personal financial planning rather than a lack of confidence in the company’s prospects, but it does warrant caution.
🟢 The **number of institutional holders is substantial at 5052**, which indicates a diversified ownership base and reduces the risk of volatility from any single investor’s actions.
🔴 The **recent insider purchases are minimal**, with only a few transactions noted, which does not provide strong bullish sentiment from those closest to the company.
Overall, while the institutional backing is a positive sign, the low insider ownership and recent selling activity suggest a cautious approach. A **buy recommendation** is warranted, but investors should monitor insider activity closely in the coming weeks.
V Analyst Ratings
The analyst ratings for V (Visa) are overwhelmingly positive, with a significant number of analysts recommending either a buy or strong buy. Over the past three months, there have been 13 strong buy ratings, 22 buy ratings, 4 hold ratings, and no sell or strong sell ratings. This indicates a very strong bullish sentiment among analysts. 🟢
In the most recent month, firms like Macquarie, TD Cowen, and Citigroup have maintained their buy ratings, reinforcing the positive outlook for the stock. The consistent support from multiple firms suggests confidence in Visa’s growth potential and market position.
Given the strong analyst support and the absence of negative ratings, it is likely that the stock will perform well in the next month. The high confidence level indicates a strong belief in this forecast. Based on current trends, Visa could see a price increase of approximately 5-7% in the next month, supported by its robust market fundamentals and positive analyst sentiment.
V Economic Analysis
Based on the US economic and market data:
🟢 The **unemployment rate** has increased slightly to **4.3%**, but this is still relatively low, indicating a stable labor market that supports consumer spending, which is crucial for Visa’s transaction volume.
🟢 **Retail sales** have shown a positive trend with a figure of **627,510**, suggesting strong consumer demand, which directly benefits Visa as more transactions occur.
🟢 The **GDP growth** of **5737.189** indicates a growing economy, which typically leads to increased spending and higher transaction volumes for Visa.
🟢 Visa’s **profit margins** are strong at **54.7%**, and with a **trailing PE ratio** of **29.90**, the company is well-positioned for growth as consumer spending increases.
🟢 The **dividend yield** of **0.81%** provides a steady income for investors, making Visa an attractive option in the current market environment.
🔴 However, the **monthly treasury yield** has increased slightly to **4.25%**, which could indicate potential pressure on growth stocks if interest rates continue to rise.
Overall, the combination of stable economic indicators and Visa’s strong fundamentals supports a positive outlook for the next month. The target price is projected to reach around **318.46**, reflecting a potential upside from the current price of **291.24**.
Disclaimer
Investors may consider the AI predictions and news summaries as one factor in their investment decisions alongside their own research and risk tolerance.

