YUM Brands Stock Analysis: A Mixed Bag of Opportunities and Caution
🔴 Recommendation: YUM Brands is currently rated as a buy, but investors should approach with caution due to mixed signals from various indicators.
📈 Key Highlights:
Financial Health: Positive net income of $367 million and year-over-year revenue growth of 10.33% indicate strong profitability and revenue generation.
Growth Potential: Despite a decline in earnings growth of -12.30%, the company shows promise with innovative marketing strategies and a commitment to sustainability.
Institutional Support: High institutional ownership at 87.48% suggests strong interest from large investors, providing a level of stability.
⚠️ Caution Flags:
High Debt Levels: Average net debt of $10.79 billion and a current ratio of 0.77 raise concerns about liquidity and financial flexibility.
Market Sentiment: Insider selling and a significant number of hold ratings from analysts indicate uncertainty about the stock’s near-term performance.
As we delve deeper into the analysis, we will explore the price trends, technical indicators, financial health, valuation metrics, and the broader economic context affecting YUM Brands. Let’s break down the details and uncover what lies ahead for this prominent player in the restaurant industry. 👇
YUM Price Analysis
| Positive Momentum Signals | Negative Momentum Signals | Hold Momentum Signals |
|---|---|---|
|
|
|
| Positive Trend Signals | Negative Trend Signals | Hold Trend Signals |
|---|---|---|
|
|
|
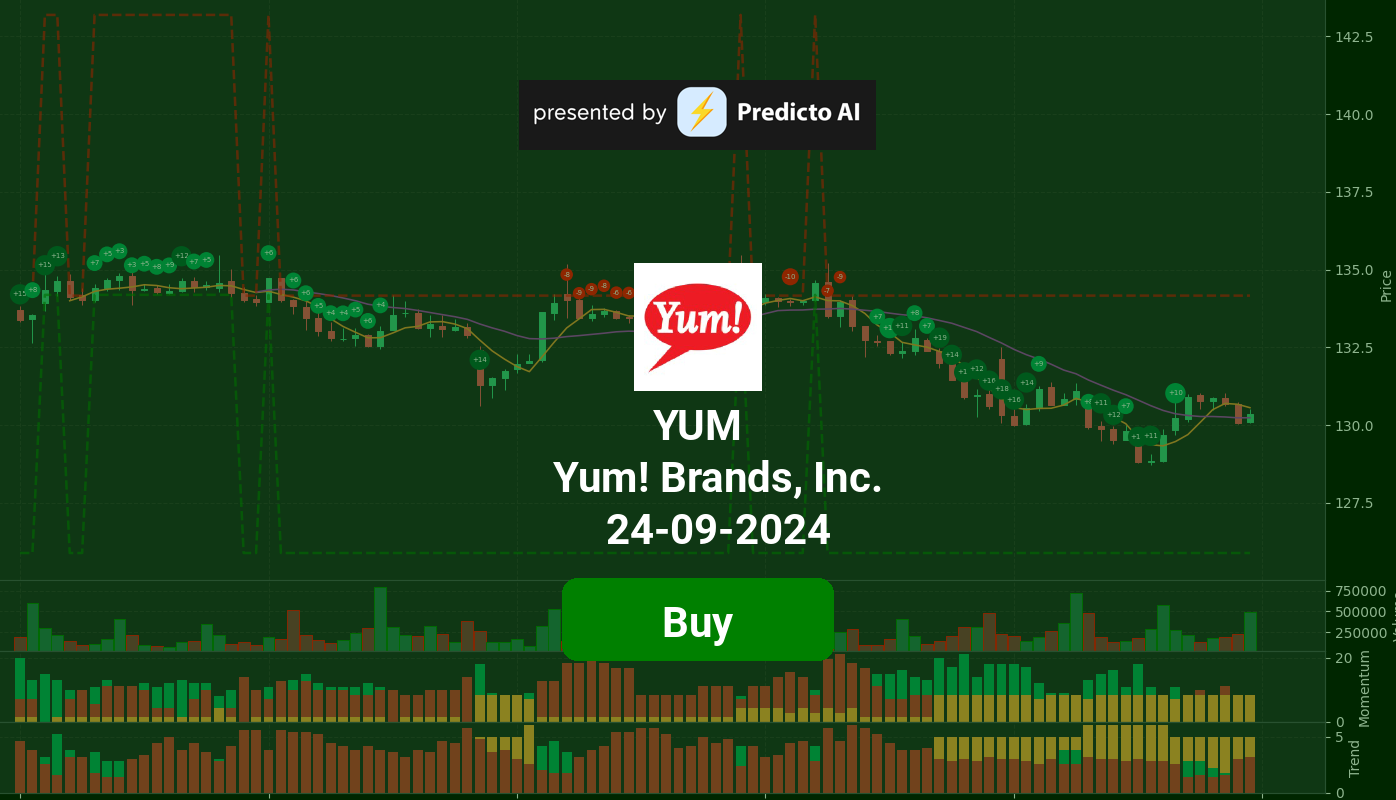
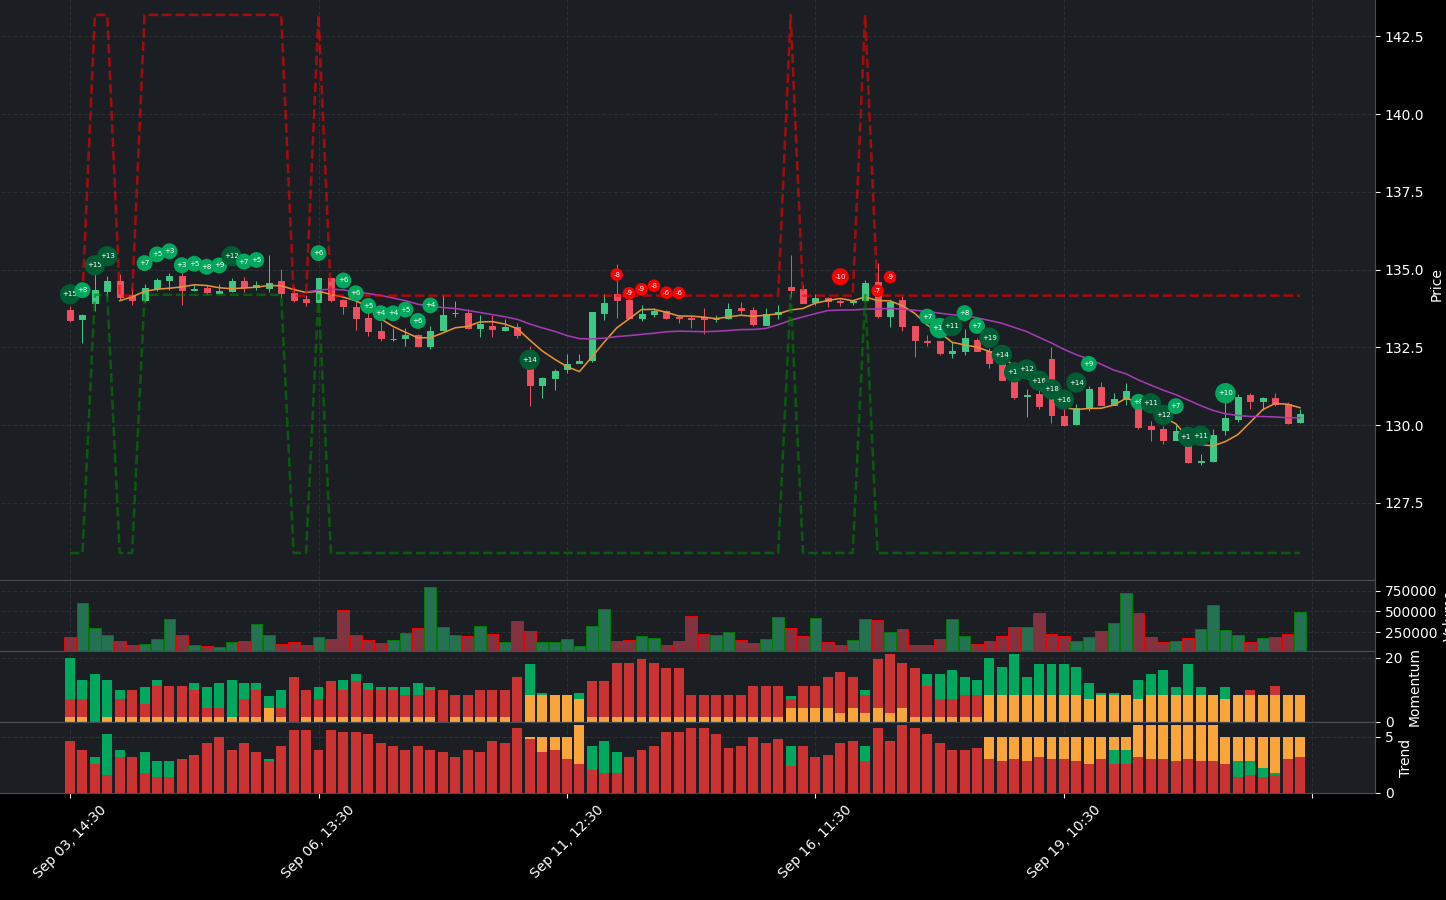
YUM Brands, Inc. presents a complex financial picture that warrants careful consideration. Currently, the stock is rated as a buy, supported by several positive momentum indicators. Notably, the WaveTrend shows a bullish divergence, suggesting a potential reversal, and the stock is oversold, indicating a possible bottom. However, investors should remain cautious as the price is rebounding towards the middle band, which could signal a potential selling opportunity in a ranging market.
On the trend front, YUM’s price is above the middle band but below the upper band, indicating an uptrend while also raising concerns about overbought conditions. The On-Balance Volume (OBV) is increasing, supported by high volume, and the Supertrend indicator confirms a bullish trend with the price above the Supertrend line. However, the stock faces significant challenges as it is trading below both the 50-day EMA and the 200-day EMA, indicating a bearish trend that is strengthening. Additionally, the MACD shows a negative histogram crossover, further complicating the outlook.
In summary, while YUM Brands has some positive momentum and trend indicators, the prevailing bearish trends and potential overbought conditions suggest that investors should approach with caution. A hold or sell recommendation may be prudent until clearer signals of sustained growth and stability emerge.
YUM Fundamental Analysis
YUM’s recent financial performance presents a mixed but ultimately positive outlook for investors. The company has demonstrated strong profitability, with a net income of $367 million in the most recent period, indicating a solid earnings foundation. Furthermore, the year-over-year increase in net income is a promising sign of the company’s financial health.
However, there are notable concerns regarding debt levels. The average net debt stands at a high $10.79 billion, which necessitates further scrutiny regarding its impact on financial flexibility. Additionally, the current ratio of 0.77 raises potential liquidity risks, suggesting that YUM may face challenges in meeting its short-term obligations. The low cash to total assets ratio of 0.09 further highlights limited financial flexibility and increased vulnerability to economic downturns.
In terms of valuation, YUM’s forward P/E ratio of 20.73 indicates a reasonable valuation relative to earnings expectations. However, the price-to-sales ratio of 5.16 suggests potential overvaluation when compared to revenue. The company’s earnings growth of -12.30% raises concerns about its future profitability and growth potential.
On the growth and profitability front, YUM has shown strong revenue generation, with total revenue reaching $1.76 billion and a year-over-year revenue growth of 10.33%. The operating margin of 100.00% reflects efficient operations and effective cost control, while the net profit margin of 20.82% underscores the company’s ability to generate profits after all expenses.
From a shareholder perspective, YUM has positive net cash flow from financing activities at $3.32 billion, indicating that the company is raising capital for growth or debt reduction. Additionally, stock repurchases totaling $770 million can signal confidence in the company’s future, as they reduce the number of shares outstanding and potentially boost earnings per share (EPS).
Examining the income statement, the operating margin remains strong at 100.00%, and the net profit margin of 20.82% reflects robust profitability. However, the interest expense of $121 million raises concerns, as it indicates that the company is paying more in interest on its debts than it is earning on its assets.
The balance sheet reveals a debt-to-equity ratio of -1.28, suggesting a moderate level of leverage that may be sustainable depending on the company’s industry and profitability. The average tangible book value being negative at -$9.01 billion is a significant concern, indicating that liabilities exceed assets.
On the cash flow front, YUM’s average capital expenditures of $238.5 million suggest ongoing investments in growth and expansion. The positive free cash flow of $1.09 billion indicates that the company has cash available for investments, debt reduction, or dividends.
Overall, while there are concerns regarding debt levels and liquidity, the strong revenue growth, profitability margins, and positive cash flow indicate that YUM is positioned well for future growth. Therefore, the recommendation is to buy.
Financial Health
🟢 Net Income for the most recent period was positive at $367 million, indicating profitability.
🟢 Year-over-year net income increased, which is a positive sign for the company’s financial health.
🔴 Average Net Debt is high at $10.79 billion, warranting further investigation into its impact on financial flexibility.
🔴 Current Ratio of 0.77 suggests potential liquidity risk, as the company might face challenges in meeting its short-term financial obligations.
🔴 Cash to Total Assets Ratio is low at 0.09, indicating limited financial flexibility and higher vulnerability to economic shocks.
Valuation
🟢 Forward P/E ratio of 20.73 indicates reasonable valuation relative to earnings expectations.
🔴 Price-to-Sales Ratio of 5.16 suggests potential overvaluation compared to revenue.
🔴 Earnings Growth of -12.30% raises concerns about future profitability and growth potential.
Growth and Profitability
🟢 Total revenue for the most recent period was $1.76 billion, showing strong revenue generation.
🟢 Year-over-year revenue growth was 10.33%, indicating strong growth potential.
🟢 Operating Margin of 100.00% suggests efficient operations and good cost control.
🟢 Net Profit Margin of 20.82% reflects the company’s ability to generate profits after all expenses.
Shareholder Information
🟢 Positive net cash flow from financing activities at $3.32 billion indicates the company is raising capital for growth or debt reduction.
🟢 Stock repurchases of $770 million can be a positive signal as it reduces the number of shares outstanding, potentially boosting earnings per share (EPS).
Income Statement
🟢 Operating Margin of 100.00% suggests efficient operations.
🟢 Net Profit Margin of 20.82% reflects strong profitability after expenses.
🔴 Interest Expense of $121 million indicates the company is paying more in interest on its debts than it is earning on its assets, which could be a concern.
Balance Sheet
🔴 Debt-to-Equity Ratio of -1.28 suggests a moderate level of leverage, which may be sustainable depending on the company’s industry and profitability.
🔴 Average Tangible Book Value is negative at -$9.01 billion, indicating that liabilities exceed assets, which is a significant concern.
Cashflow
🟢 Average Capital Expenditures of $238.5 million suggest the company is investing in growth and expansion.
🟢 Positive free cash flow of $1.09 billion indicates the company has cash available for investments, debt reduction, or dividends.
Overall, while there are some concerns regarding debt levels and liquidity, the strong revenue growth, profitability margins, and positive cash flow indicate that YUM is positioned well for future growth. Therefore, the recommendation is to buy.
YUM News Analysis
YUM Brands (YUM) is facing mixed signals from recent news, with insider selling raising concerns while innovative marketing strategies may enhance brand visibility.
Summary of YUM news indicates a blend of caution and opportunity for investors. The insider selling could signal a lack of confidence from executives, while the company’s creative marketing initiatives may attract consumer interest. Investors should weigh these factors carefully.
🔴 Yum Brands insider sold shares worth $941,682, which may raise concerns about insider confidence in the company’s future performance.
🟢 Pizza Hut’s launch of ‘ResZAmes’, a pizza box that doubles as a resume, showcases innovative marketing aimed at supporting job seekers, potentially enhancing brand engagement.
🟢 Pepsi’s guarantee that every pizza delivery includes a Pepsi aims to improve customer satisfaction and could drive sales.
🔴 YUM has seen a 1.2% decline since its last earnings report, raising questions about its ability to rebound in the near term.
🟢 The collaboration with Starbucks and Dunkin’ Donuts to test reusable cups indicates a commitment to sustainability, which may resonate well with environmentally conscious consumers.
🔴 The narrowing price gap between fast food and fast casual dining could pressure YUM’s pricing strategy and margins.
🟢 The Pizza Hut Foundation’s scholarship program reflects corporate social responsibility, which can enhance brand loyalty among consumers.
🟢 The unveiling of specialty pizza boxes that turn into tables for moving day is a creative marketing strategy that could attract attention and drive sales.
YUM Holders Analysis
The financial landscape for YUM appears mixed, with significant institutional ownership but low insider confidence. This suggests a cautious approach for the next month.
🟢 YUM has a high institutional ownership at **87.48%**, indicating strong interest from large investors. This level of institutional backing often provides stability and confidence in the stock’s performance.
🔴 However, insider ownership is very low at **0.14%**, which may reflect a lack of confidence from company management or a high degree of external control. This could be a red flag for potential investors.
🟡 The number of institutional holders is substantial at **1593**, suggesting a diversified ownership base. This can mitigate risks associated with volatility, but it also means that any significant sell-off by these institutions could impact the stock price.
🟡 Recent insider transactions show a mix of sales and minimal purchases, indicating that insiders may not be fully confident in the stock’s near-term prospects. The lack of significant buying activity from insiders could be interpreted as a lack of strong bullish sentiment.
🔴 The overall market conditions and economic factors may also play a role in YUM’s performance. If consumer spending declines or if there are adverse economic indicators, this could negatively impact the stock.
YUM Analyst Ratings
The analyst ratings for YUM have shown a mixed sentiment, with a notable number of hold ratings dominating the recommendations. Currently, there are 5 strong buy ratings, 7 buy ratings, 13 hold ratings, and no sell or strong sell ratings. This indicates a cautious approach from analysts towards YUM’s stock performance. 🔴
In the past month, the ratings reflect a stable outlook, but the lack of sell recommendations suggests that analysts are not overly bearish. However, the significant number of hold ratings indicates uncertainty about the stock’s near-term performance.
🟡 Given the recent upgrades and downgrades, particularly the neutral stance from JP Morgan and the consistent buy ratings from TD Cowen, it appears that YUM may experience moderate fluctuations in the next month. The stock is likely to remain stable, with potential for slight upward movement if positive developments occur.
Overall, while the sentiment is not overwhelmingly positive, the absence of strong sell ratings provides a buffer against significant declines. Therefore, investors should approach with caution but remain open to potential opportunities.
YUM Economic Analysis
Based on the US economic and market data:
🔴 The unemployment rate has increased to 4.3%, up from 4.1% in the previous month, indicating a potential slowdown in the labor market. This could lead to reduced consumer spending, which is critical for restaurant chains like Yum! Brands.
🟡 Retail sales have shown a slight increase to 627,510, but this is not a significant jump compared to previous months. This suggests that while there is some consumer activity, it may not be robust enough to drive substantial growth for Yum! Brands.
🟢 The GDP growth rate remains stable, which is a positive sign for the overall economy. A stable GDP can support consumer confidence and spending, which is beneficial for the restaurant industry.
🔴 Inflation remains a concern, with the CPI showing a slight increase. Higher inflation can lead to increased costs for Yum! Brands, impacting profit margins if they cannot pass these costs onto consumers.
Overall, the mixed signals from the economic data suggest that Yum! Brands may face challenges in the coming month, particularly with rising unemployment and inflation pressures. The stock price may remain relatively stable but could be susceptible to downward pressure if consumer spending does not pick up.
Disclaimer
Investors may consider the AI predictions and news summaries as one factor in their investment decisions alongside their own research and risk tolerance.

