MDT Stock Analysis: A Cautious Outlook Ahead!
🔴 Recommendation: Medtronic plc (MDT) is currently rated a strong sell, reflecting significant concerns despite some positive indicators.
📈 Key Highlights:
Financial Health: Average net debt stands at a concerning $24.20 billion, raising questions about the company’s financial flexibility.
Profitability: Positive net income of $1.04 billion showcases the company’s ability to generate profits, but year-over-year revenue growth has declined by -7.85%.
Institutional Support: High institutional ownership at 85.96% indicates strong interest from large investors, suggesting some confidence in the company’s future performance.
⚠️ Caution Flags:
Negative Momentum: Bearish divergences in both On-Balance Volume and Money Flow Index signal increasing selling pressure.
Liquidity Risk: A low current ratio of 0.23 indicates potential challenges in meeting short-term obligations.
Overvaluation Concerns: A Price-to-Sales Ratio of 3.54 suggests that the stock may be overvalued compared to its revenue generation.
Let’s dive into the details as we break down the price trends, indicators, financial health, valuation metrics, and more 👇
MDT Price Analysis

| Positive Momentum Signals | Negative Momentum Signals | Hold Momentum Signals |
|---|---|---|
|
|
| Positive Trend Signals | Negative Trend Signals | Hold Trend Signals |
|---|---|---|
|
|
|
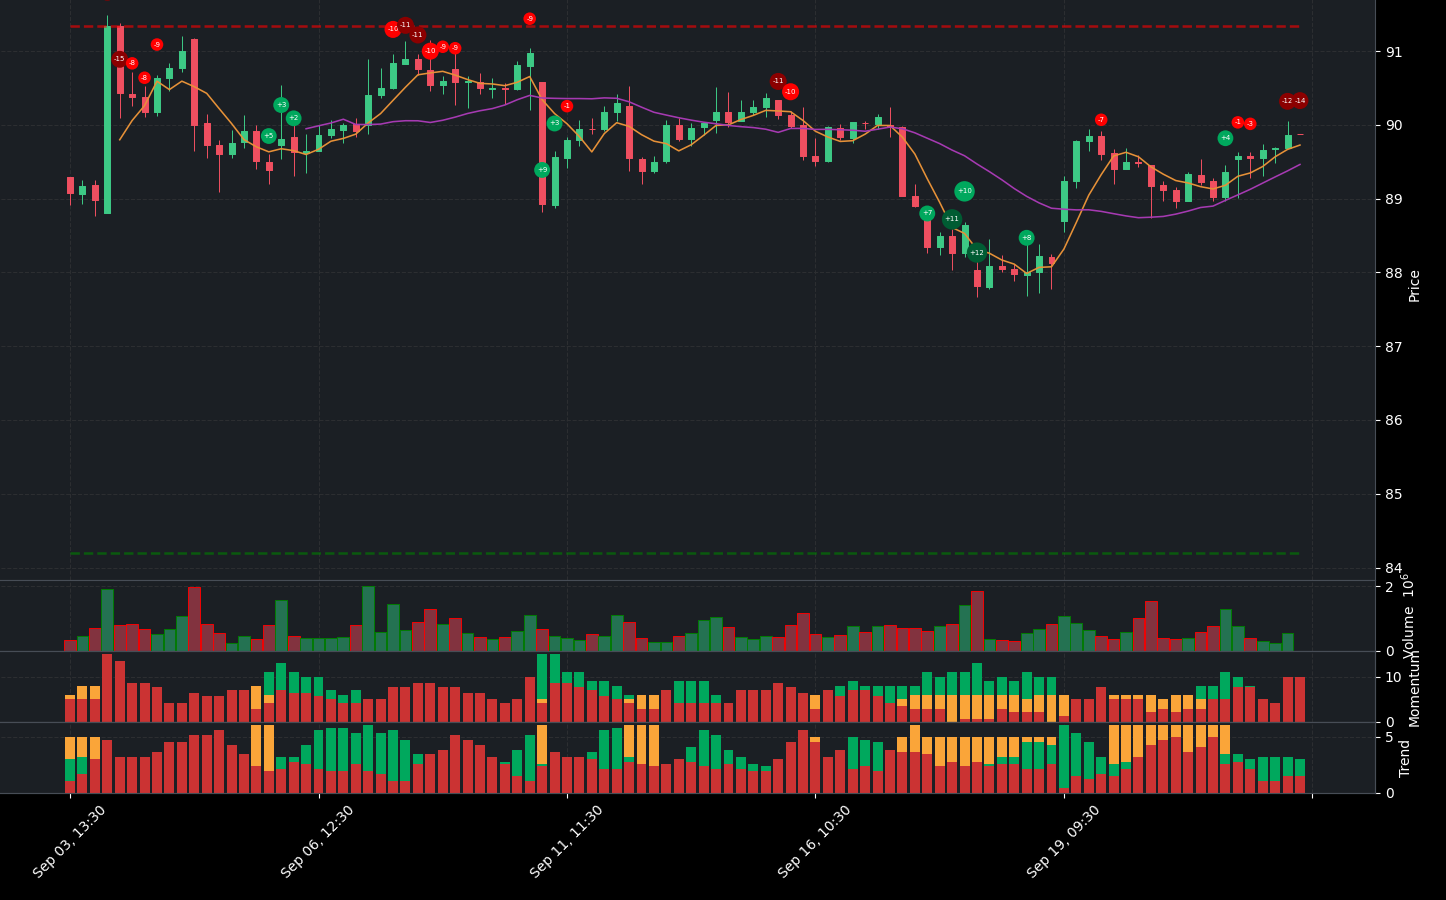
Medtronic plc (MDT) presents a complex financial picture that leans towards caution for potential investors. Currently, the stock is rated a strong sell, reflecting significant concerns despite some positive indicators.
On the momentum front, there are notable negative momentum indicators that raise alarms. The On-Balance Volume (OBV) shows a bearish divergence, which has been confirmed, suggesting that selling pressure is increasing. Additionally, the Money Flow Index (MFI) also indicates a bearish divergence, while the Stochastic RSI is in an overbought condition. Furthermore, the stock’s position is closer to resistance, indicating potential challenges in maintaining upward momentum.
In terms of trend indicators, MDT does exhibit some positive signs. The stock price is currently above the 50-day and 200-day Exponential Moving Averages (EMAs), which typically signals a bullish trend. The price is also above the Supertrend, reinforcing the notion of a bullish trend. However, caution is warranted as the price is below the upper band of the Bollinger Bands, indicating that while the stock is in an uptrend, it may be approaching overbought conditions.
Despite these bullish trends, the negative trend indicators cannot be overlooked. The stock’s position being closer to resistance suggests that it may struggle to break through key levels, which could lead to a pullback.
Given the combination of bearish momentum indicators and the cautious bullish trend signals, investors should approach MDT with a strong sell recommendation. The current market conditions and technical indicators suggest that the stock may face significant challenges ahead, making it prudent to reconsider any investment in Medtronic at this time.
MDT Fundamental Analysis
MDT’s recent financial performance presents a mixed picture, prompting a neutral stance on the stock. On one hand, the company demonstrates profitability with a positive net income of $1.04 billion and an impressive operating margin of 100.00%, indicating efficient operations and strong cost control. Additionally, a net profit margin of 13.16% reflects the company’s ability to generate profits after all expenses.
However, several concerning trends overshadow these positives. The company faces a significant challenge with a year-over-year revenue decline of 7.85%, which raises questions about future growth prospects. Furthermore, the average net debt stands at a high $24.20 billion, raising concerns about MDT’s financial flexibility and its ability to service its debt obligations. This is compounded by a low current ratio of 0.23, suggesting potential liquidity risks as the company may struggle to meet its short-term financial commitments.
From a valuation perspective, the forward P/E ratio of 15.36 indicates that the stock may be fairly valued relative to its earnings growth potential. However, the price-to-sales ratio of 3.54 suggests that the stock could be overvalued in relation to its revenue generation, adding to the caution surrounding the investment.
The balance sheet reveals further issues, with an average tangible book value of -$4.22 billion indicating that liabilities exceed assets, a concerning sign for investors. Additionally, a low cash to total assets ratio of 0.02 highlights limited financial flexibility and increased vulnerability to economic shocks.
On a more positive note, MDT has positive net cash flow from financing activities at $9.39 billion, indicating that the company is raising capital, which could be utilized for growth or debt reduction. The stock repurchase activity of $1.49 billion is also a positive signal, as it reduces the number of shares outstanding and may enhance earnings per share (EPS).
In terms of cash flow, the average capital expenditures of $1.44 billion suggest that MDT is investing in growth and expansion. The positive free cash flow of $4.90 billion indicates that the company has cash available for investments, debt reduction, or dividends.
In summary, while MDT showcases some strengths in profitability and operational efficiency, the decline in revenue, high debt levels, and liquidity concerns warrant a cautious approach. Investors should carefully consider these factors before making any investment decisions regarding MDT stock.
Financial Health
🔴 Average Net Debt is high at $24.20 billion, which raises concerns about the company’s financial flexibility and ability to service its debt obligations.
🔴 Current Ratio is low at 0.23, indicating potential liquidity risk, as the company may struggle to meet its short-term financial obligations.
🟢 Debt-to-Equity Ratio of -6.07 suggests a moderate level of leverage, which may be sustainable depending on the company’s industry and profitability.
Valuation
🟢 Forward P/E ratio of 15.36 indicates that the stock may be fairly valued relative to its earnings growth potential.
🔴 Price-to-Sales Ratio of 3.54 suggests that the stock may be overvalued compared to its revenue generation.
Growth and Profitability
🟢 Net Income for the most recent period was positive at $1.04 billion, showing profitability.
🔴 Year-over-year revenue growth was -7.85%, indicating a decline in revenue, which could negatively impact the stock price.
🟢 Operating Margin of 100.00% suggests efficient operations and good cost control.
🟢 Net Profit Margin of 13.16% reflects the company’s ability to generate profits after all expenses.
Shareholder Information
🟢 Positive net cash flow from financing activities at $9.39 billion indicates that the company is raising capital, which could be used for growth or debt reduction.
🟢 Stock repurchases of $1.49 billion can be a positive signal as it reduces the number of shares outstanding and may boost earnings per share (EPS).
Income Statement
🔴 Year-over-year revenue growth of -7.85% indicates a decline in revenue, which could negatively impact future performance.
🟢 Operating Margin of 100.00% suggests efficient operations.
🟢 Net Profit Margin of 13.16% reflects the company’s ability to generate profits after expenses.
Balance Sheet
🔴 Average Tangible Book Value is negative at -$4.22 billion, indicating that the company’s liabilities exceed its assets, which is a concerning sign.
🔴 Cash to Total Assets Ratio is low at 0.02, indicating limited financial flexibility and a higher vulnerability to economic shocks.
Cashflow
🟢 Average Capital Expenditures of $1.44 billion suggest that the company is investing in growth and expansion.
🟢 Positive free cash flow of $4.90 billion indicates that the company has cash available for investments, debt reduction, or dividends.
Overall, while there are some positive indicators such as profitability and efficient operations, the decline in revenue and liquidity concerns warrant a neutral stance on the stock.
MDT News Analysis
Medtronic (MDT) faces a challenging landscape with mixed news affecting its stock outlook.
Summary of MDT news indicates a challenging environment for Medtronic investors. The company has struggled over the past three years, but it is also making strides in product development and legal matters. Investors should weigh the negative performance history against the potential for future growth from new product launches and favorable legal outcomes.
🔴 The past three years for Medtronic (NYSE:MDT) investors has not been profitable, indicating a concerning trend for current shareholders.
🟢 Medtronic’s Aurora EV-ICD is set to challenge Boston Scientific’s S-ICD market leadership, which could enhance its competitive position in the market.
🟢 A recent article suggests that MDT could be a good pick for momentum investors, hinting at potential upward movement in stock price.
🟢 MDT has seen a slight increase of 0.7% since its last earnings report, suggesting some stability in the stock.
🔴 A jury sided with Axonics in a patent dispute against Medtronic, which could negatively impact MDT’s market position and innovation.
🔴 Another ruling found that Axonics did not infringe on Medtronic’s patents, further complicating MDT’s competitive landscape.
🟢 Medtronic teased positive data from a deep brain stimulation trial, which could lead to new opportunities and revenue streams if results are favorable.
MDT Holders Analysis
The financial health of MDT shows a mixed outlook, leading to a neutral recommendation for the next month. While there are positive aspects, certain concerns need to be addressed.
🟢 MDT has a high institutional ownership at **85.96%**, indicating strong interest from large investors, which typically suggests confidence in the company’s future performance. This level of institutional backing can provide stability and support for the stock price.
🔴 The **very low insider ownership of 0.26%** raises concerns about management’s confidence in the company. This could indicate a lack of alignment between management and shareholders, which is often viewed negatively by the market.
🟡 The number of institutional holders is substantial at **2748**, suggesting a diversified ownership base. This can help mitigate volatility, but it also means that if large investors decide to sell, it could lead to significant price fluctuations.
🟡 Recent insider transactions show a mix of sales and purchases, with a notable number of shares sold. This could imply that insiders are cashing out, which may not be a strong signal of confidence in the company’s near-term prospects.
🔴 The overall sentiment from insider transactions leans towards selling, which could be interpreted as a lack of confidence in the stock’s immediate future.
MDT Analyst Ratings
The analyst ratings for MDT show a mixed sentiment, with a total of 4 strong buy ratings, 7 buy ratings, 12 hold ratings, and no sell or strong sell ratings in the most recent month. This indicates a cautious outlook among analysts. 🟡 Over the past three months, there has been a slight decline in strong buy ratings from 9 to 4, while buy ratings have also decreased from 14 to 7. The hold ratings have increased, suggesting that analysts are leaning towards a more conservative approach.
🟢 Despite the mixed ratings, the absence of sell or strong sell recommendations indicates that analysts do not foresee significant downside risk in the near term. However, the overall sentiment is tempered by the increasing number of hold ratings, which may reflect concerns about market conditions or company performance.
In the next month, MDT is expected to maintain its current price range, with potential fluctuations around the $80-$85 mark, as analysts await further developments. The medium confidence level suggests that while there is no immediate cause for alarm, investors should remain vigilant.
MDT Economic Analysis
Based on the US economic and market data:
🟢 The unemployment rate has increased slightly to 4.3%, but it remains relatively low, indicating a stable labor market. This stability can support consumer spending, which is beneficial for Medtronic’s sales in medical devices.
🟢 Retail sales have shown an increase to 627,510, suggesting healthy consumer demand, which could positively impact Medtronic’s revenue from its diverse product offerings.
🔴 The recent increase in the Monthly Treasury Yield to 4.25% may indicate rising borrowing costs, which could pressure Medtronic’s operational costs and affect profit margins.
🟡 The CPI remains stable, but inflationary pressures could lead to increased costs for Medtronic’s raw materials, impacting profitability.
🟢 Medtronic’s strong fundamentals, including a trailing PE ratio of 30.26 and a forward PE of 15.36, suggest that the stock is reasonably valued compared to its growth potential.
Overall, while there are some concerns regarding inflation and rising yields, the positive indicators in consumer spending and a stable labor market support a bullish outlook for Medtronic in the next month. The stock price could potentially reach the target mean price of 94.34, representing an upside of approximately 5% from the current price of 89.87.
Disclaimer
Investors may consider the AI predictions and news summaries as one factor in their investment decisions alongside their own research and risk tolerance.


