AAPL Stock Analysis: A Cautiously Optimistic Outlook
🔴 Recommendation: AAPL is currently exhibiting a mixed outlook, with strong bullish trends tempered by some concerning financial indicators and market dynamics.
📈 Key Highlights:
Technical Indicators: AAPL is in a bullish trend, with the price above both the 50-day and 200-day EMA, signaling upward momentum. However, caution is warranted as the stock approaches potential overbought conditions.
Financial Health: Despite a robust net income of $21.44 billion, the year-over-year trend shows a decline, raising questions about future profitability. The high Debt-to-Equity Ratio of 1.62 indicates significant financial leverage.
Growth and Profitability: Operating margins remain strong at 100%, but a year-over-year revenue decline of -5.48% is concerning for long-term growth.
⚠️ Caution Flags:
High Debt Levels: With an average net debt of $75.38 billion, AAPL’s financial flexibility may be at risk.
Market Volatility: Recent news indicates a drop in stock price despite broader market gains, suggesting potential investor concerns.
Let’s dive into the details as we break down the price trends, indicators, financial health, valuation metrics, and more 👇
AAPL Price Analysis

| Positive Momentum Signals | Negative Momentum Signals | Hold Momentum Signals |
|---|---|---|
|
| Positive Trend Signals | Negative Trend Signals | Hold Trend Signals |
|---|---|---|
|
|
|
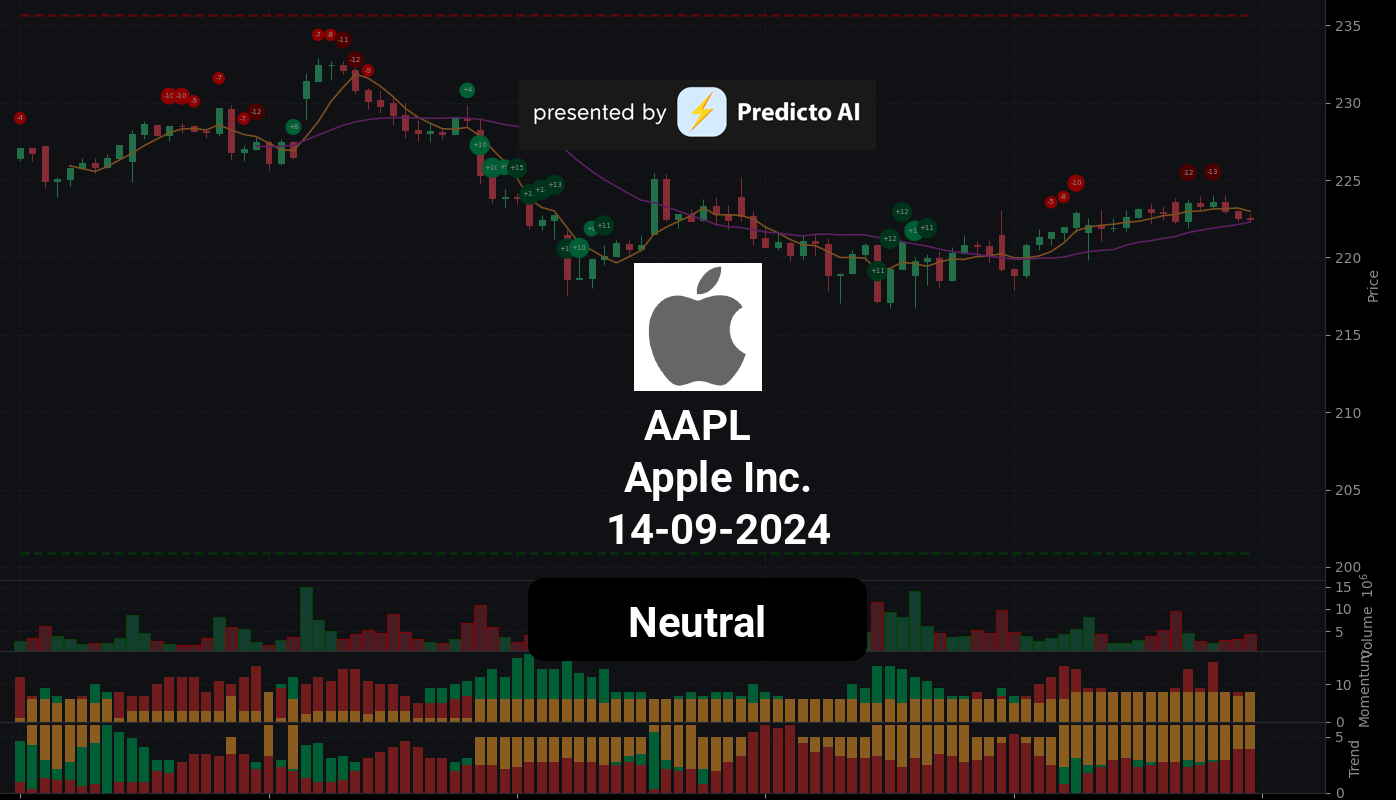
AAPL stock presents a complex picture for investors. On the positive side, the stock is currently in a bullish trend, with the price positioned above both the 50-day and 200-day EMA, indicating a strengthening bullish trend. Additionally, the price is above the Supertrend indicator, further supporting the notion of upward momentum. However, caution is warranted as the price is above the middle band but below the upper band, suggesting that while the stock is in an uptrend, it may be approaching overbought conditions.
Despite these positive indicators, there are notable concerns. The On-Balance Volume (OBV) is decreasing, which could signal weakening buying pressure. Furthermore, the MACD has shown a negative histogram crossover, indicating potential bearish momentum. These negative momentum indicators suggest that while the stock is currently performing well, there are signs that the upward momentum may be losing steam.
In summary, AAPL stock is exhibiting a bullish trend with strong technical indicators, but the decreasing OBV and negative MACD crossover raise red flags. Investors should remain vigilant and consider a hold strategy, monitoring for any signs of a trend reversal or further weakening in momentum before making additional investment decisions.
AAPL Fundamental Analysis
AAPL’s recent financial performance presents a mixed picture, with several concerning trends that could impact its future prospects.
The company’s **net income** for the most recent period stands at **$21.44 billion**, but the year-over-year trend shows a **decline**, raising questions about its future profitability. Additionally, the **average net debt** is notably high at **$75.38 billion**, which necessitates a closer examination of its implications for financial flexibility and debt servicing capabilities. The **debt-to-equity ratio** of **1.62** indicates a significant level of financial leverage, posing potential risks, especially during economic downturns. On a positive note, the **current ratio** of **1.35** suggests a healthy liquidity position, indicating that the company can comfortably cover its short-term liabilities. However, the **cash to total assets ratio** of **0.09** is relatively low, highlighting limited financial flexibility and increased vulnerability to economic shocks.
In terms of **valuation**, the **forward P/E ratio** of **29.75** suggests potential overvaluation, as it exceeds the typical threshold of **25**. Similarly, the **price-to-sales ratio** of **8.77** indicates that the stock may be overvalued relative to its sales figures.
When examining **growth and profitability**, AAPL faces challenges with a **year-over-year revenue growth** of **-5.48%**, indicating a decline that could negatively affect the stock price. However, the company maintains an impressive **operating margin** of **100.00%**, reflecting efficient operations and strong cost control. The **net profit margin** of **25.00%** further underscores AAPL’s ability to generate profits after accounting for all expenses.
From a **shareholder perspective**, the company has engaged in **stock repurchases** totaling **$81.32 billion**, which can signal confidence in the company’s future and may enhance earnings per share (EPS) by reducing the number of shares outstanding. However, the **average ordinary shares outstanding** at **15.44 billion** raises potential dilution concerns if new shares are issued.
The **income statement** reveals a troubling decline in revenue growth and net income trends, which raises concerns about the company’s future profitability. Nevertheless, the strong profit margins indicate effective profit generation.
On the **balance sheet**, the **average total debt** of **$109.43 billion** warrants further analysis to understand its composition and terms, which could significantly impact financial health. The **debt-to-equity ratio** of **1.62** again raises concerns about financial risk and leverage, although the **average tangible book value** of **$67.48 billion** suggests a solid equity base after deducting liabilities from assets.
In terms of **cash flow**, AAPL shows promise with **average capital expenditures** of **$10.02 billion**, indicating investment in growth and expansion. Additionally, **positive net cash from financing** of **$22.31 billion** suggests that the company is raising capital, which could be utilized for growth initiatives or debt reduction.
Overall, while AAPL exhibits some positive indicators regarding profitability and operational efficiency, the declining revenue and high levels of debt raise significant concerns about the company’s financial health and future growth prospects. Investors should approach AAPL with caution, considering the potential risks associated with its current trajectory.
Financial Health
🔴 Net Income for the most recent period was $21.44 billion, but the year-over-year net income trend shows a decrease, raising concerns about future profitability.
🔴 The Average Net Debt is high at $75.38 billion, which warrants further investigation into its impact on financial flexibility and debt servicing capabilities.
🔴 The Debt-to-Equity Ratio of 1.62 indicates a high level of financial leverage, which could pose risks during economic downturns.
🟢 The Current Ratio of 1.35 suggests a healthy liquidity position, indicating the company can cover its short-term liabilities comfortably.
🔴 The Cash to Total Assets Ratio of 0.09 is relatively low, indicating limited financial flexibility and vulnerability to economic shocks.
Valuation
🔴 The Forward P/E ratio of 29.75 indicates potential overvaluation, as it is above the typical threshold of 25.
🔴 The Price-to-Sales Ratio of 8.77 is also high, suggesting that the stock may be overvalued relative to its sales.
Growth and Profitability
🔴 Year-over-year revenue growth of -5.48% indicates a decline in revenue, which could negatively impact the stock price.
🟢 Operating Margin of 100.00% suggests efficient operations and good cost control.
🟢 Net Profit Margin of 25.00% reflects the company’s strong ability to generate profits after all expenses.
Shareholder Information
🟢 Stock Repurchases of $81.32 billion can be a positive signal, as they reduce the number of shares outstanding and may boost earnings per share (EPS).
🔴 Average Ordinary Shares Outstanding at 15.44 billion indicates potential dilution concerns if shares are issued.
Income Statement
🔴 The decline in revenue growth and net income trend raises concerns about the company’s future profitability.
🟢 The strong profit margins indicate the company’s ability to generate profits effectively.
Balance Sheet
🔴 The Average Total Debt of $109.43 billion requires further analysis to understand its composition and terms, which could impact financial health.
🔴 The Debt-to-Equity Ratio of 1.62 raises concerns about financial risk and leverage.
🟢 The Average Tangible Book Value of $67.48 billion represents the net worth of the company after deducting liabilities from assets, indicating a solid equity base.
Cashflow
🟢 Average Capital Expenditures of $10.02 billion suggest that the company is investing in growth and expansion.
🟢 Positive Net Cash from Financing of $22.31 billion indicates that the company is raising capital, which could be used for growth or debt reduction.
Overall, while there are some positive indicators regarding profitability and operational efficiency, the declining revenue and high levels of debt raise concerns about the company’s financial health and future growth prospects.
AAPL News Analysis
A mixed outlook for Apple Inc. (AAPL) as recent news presents both challenges and opportunities.
Summary of AAPL news indicates a blend of positive developments and negative pressures. The stock has faced a drop despite broader market gains, but the launch of the AI-enabled iPhone 16 and FDA approval for AirPods Pro hearing aid software are promising. Investors should weigh these factors carefully.
🔴 Apple (AAPL) stock has dropped despite overall market gains, indicating potential investor concerns or profit-taking. This could reflect broader market volatility or specific issues within the company.
🟢 Apple has begun taking preorders for its AI-enabled iPhone 16 handsets, which could drive sales and enhance its competitive edge in the smartphone market. This launch is crucial for maintaining momentum in a highly competitive sector.
🔴 The company is seeking dismissal of a lawsuit against the Israeli cyber intelligence firm NSO Group, which could indicate ongoing legal challenges that may distract from its core business operations.
🟢 The FDA has approved an over-the-counter hearing aid software device for Apple AirPods Pro, expanding the product’s functionality and potentially increasing its market appeal. This could lead to new revenue streams and enhance customer loyalty.
🟢 Alternative app stores will be allowed on Apple iPads in the EU starting September 16, which may open new avenues for revenue but also presents challenges in terms of competition and regulatory compliance.
🟢 The start of iPhone 16 pre-orders is a significant event for investors, as it could lead to strong sales figures in the upcoming quarter, positively impacting AAPL’s stock performance.
🔴 A report suggests that growth among major tech stocks, including AAPL, may decelerate, which could affect investor sentiment and stock performance in the near term.
🟢 A recent review highlights the stock market rally, with Apple iPhone 16 in focus, suggesting that investor interest remains strong despite some headwinds.
AAPL Holders Analysis
The financial landscape for AAPL shows a mix of positive and negative indicators, leading to a cautious but optimistic buy recommendation for the next month.
🟢 AAPL has a **high institutional ownership** at **60.88%**, indicating strong interest from large investors, which typically supports stock stability and growth. Major holders like Vanguard and Blackrock are significant players, suggesting confidence in AAPL’s future.
🟡 The **low insider ownership** at **2.70%** raises concerns about alignment between management and shareholders. This could lead to decisions that may not fully reflect shareholder interests.
🟢 The **number of institutional holders** is substantial at **6496**, which indicates a diversified ownership base and reduces the risk of volatility from any single investor’s actions.
🟡 Recent **insider transactions** show a mix of sales and purchases, with more sales than purchases in the last six months. This could signal a lack of confidence among insiders, but it is essential to note that many of these transactions are likely pre-planned.
🔴 The **insider purchases** are relatively low compared to sales, which may indicate that insiders are not as bullish on the stock’s short-term prospects.
🔴 There has been some **decline in institutional ownership** in recent quarters, which could suggest that some investors are taking profits or reassessing their positions in light of market conditions.
AAPL Analyst Ratings
The analyst ratings for AAPL are overwhelmingly positive, with a significant number of analysts recommending either a buy or strong buy. In the most recent month, there were 12 strong buy ratings, 21 buy ratings, 10 hold ratings, 1 sell rating, and no strong sell ratings. This indicates a very bullish sentiment among analysts. 🟢
The recent upgrades from firms like JP Morgan, Oppenheimer, and Wedbush reinforce this positive outlook. The consistent recommendation for buy or strong buy from multiple reputable firms suggests strong confidence in AAPL’s performance.
Looking ahead, the stock is expected to perform well over the next month, with a forecasted price increase of approximately 5-7% based on current trends and analyst sentiment. The high confidence level reflects the strong backing from analysts and the company’s solid fundamentals.
AAPL Economic Analysis
Based on the US economic and market data:
🟢 The **unemployment rate** has increased slightly to **4.3%**, but it remains relatively low, indicating a stable labor market. This can support consumer spending, which is crucial for Apple’s product sales.
🟢 **Retail sales** have shown an increase to **627,510**, suggesting that consumers are willing to spend, which is positive for Apple’s revenue from its various product lines.
🟡 The **CPI** remains stable at **314.540**, indicating that inflation is under control. However, the Federal Reserve’s interest rate decisions could still impact growth stocks like Apple.
🔴 The **monthly treasury yield** has increased slightly to **4.25%**, which could lead to higher borrowing costs for consumers and businesses, potentially affecting Apple’s sales and margins.
🟢 Apple’s strong fundamentals, including a **market cap of over $3.38 trillion** and a **trailing PE ratio of 33.87**, indicate that the company is well-positioned to weather economic fluctuations.
In the next month, I expect AAPL to trade between **$215 and $230**. The current price of **$222.5** suggests a potential upside, supported by consumer spending trends and stable economic indicators. However, the slight increase in unemployment and treasury yields warrants caution. Overall, the outlook is cautiously optimistic, leaning towards a **buy** recommendation.
Disclaimer
Investors may consider the AI predictions and news summaries as one factor in their investment decisions alongside their own research and risk tolerance.


