
AAPL Stock Analysis: A Mixed Outlook Ahead!
🔴 Recommendation: AAPL presents a complex investment landscape with both bullish and bearish indicators, suggesting a cautious approach for investors.
📈 Key Highlights:
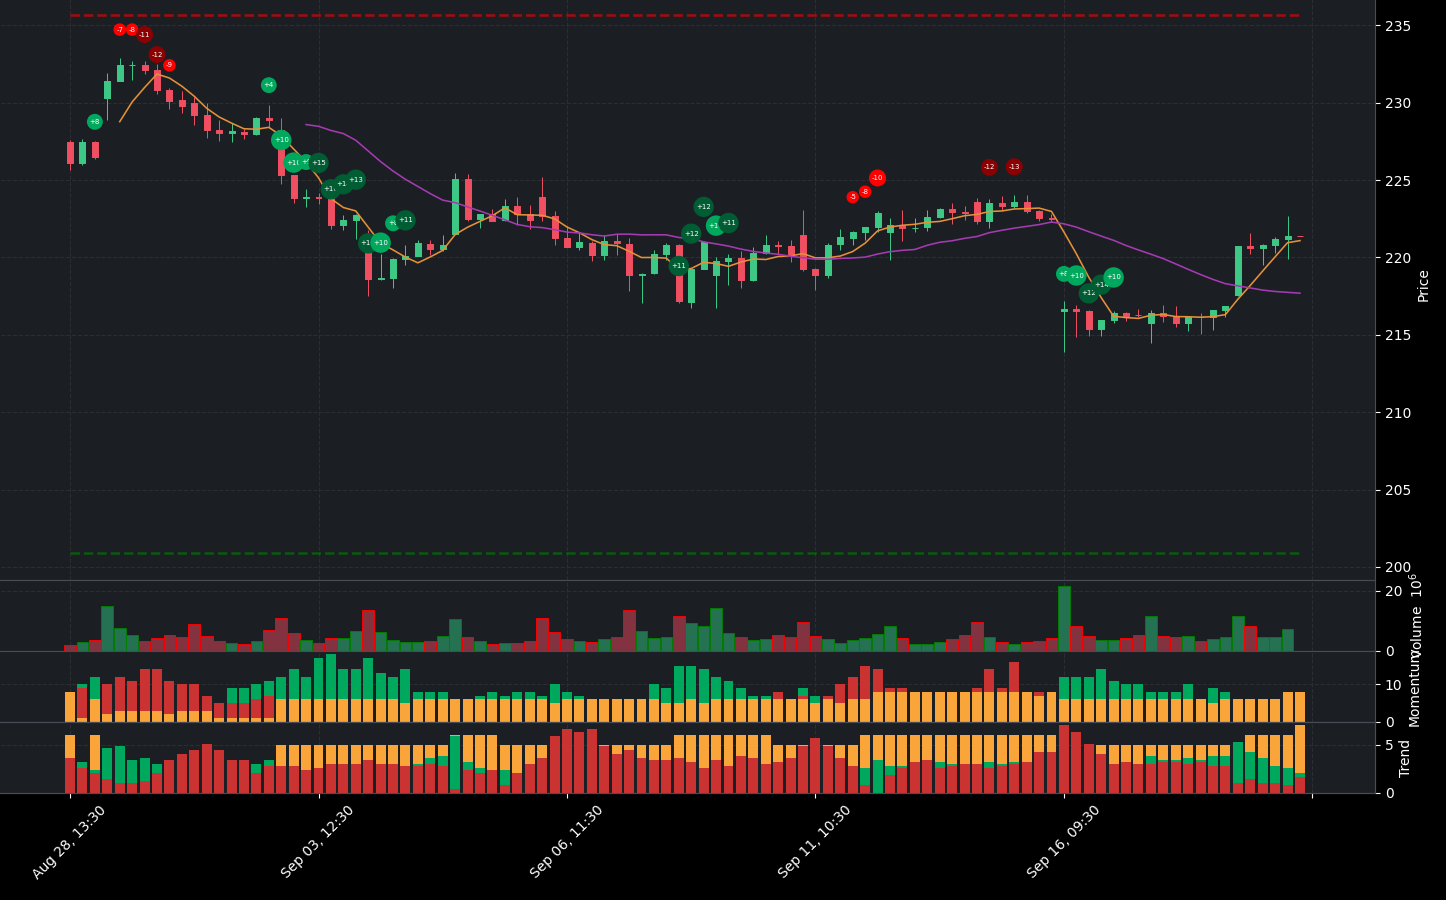
Price Action: Currently experiencing neutral price action, with the stock trading at $221.39.
Momentum Indicators: The price is above the 50-day EMA, indicating a strengthening bullish trend, but the StochRSI is in overbought territory, signaling a potential pullback.
Financial Health: Strong profit margins with a net profit margin of 25%, but concerns arise from a declining net income trend and a high debt-to-equity ratio of 1.62.
⚠️ Caution Flags:
Revenue Decline: Year-over-year revenue growth of -5.48% raises questions about future profitability.
Valuation Concerns: Forward P/E ratio of 32.94 suggests potential overvaluation, alongside a high Price-to-Sales ratio of 8.73.
As we delve deeper into the analysis, we will explore the price trends, key indicators, financial health, valuation metrics, and more to provide a comprehensive view of AAPL’s current standing and future prospects. Stay tuned for an in-depth breakdown! 👇
AAPL Price Analysis
| Positive Momentum Signals | Negative Momentum Signals | Hold Momentum Signals |
|---|---|---|
|
|
| Positive Trend Signals | Negative Trend Signals | Hold Trend Signals |
|---|---|---|
|
|
|
AAPL stock presents a complex picture for investors, characterized by both positive and negative indicators. Currently, the stock is experiencing a neutral price action, which suggests a lack of strong directional movement at this time.
On the positive side, several momentum and trend indicators are signaling bullish conditions. The price is notably above the 50-day EMA, indicating a bullish trend that is strengthening. Additionally, the Supertrend indicator confirms this bullish sentiment, as the price remains above the Supertrend line. However, caution is warranted as the StochRSI is in overbought territory, suggesting that the stock may be due for a pullback.
Despite these positive signs, there are significant concerns that investors should consider. The price is currently below the 200-day EMA, which indicates a bearish trend that is also strengthening. Furthermore, the MACD has shown a negative histogram crossover, which could signal a potential shift in momentum.
In summary, while AAPL exhibits some bullish characteristics, the presence of overbought conditions and bearish long-term trends raises red flags. Investors should approach with caution, as the stock may be vulnerable to a correction. A hold or cautious buy recommendation is advisable until clearer signals of sustained upward momentum emerge.
AAPL Fundamental Analysis
AAPL’s recent financial performance presents a mixed picture, with several concerning trends that could impact its future prospects.
The company’s net income for the most recent period stands at $21.44 billion; however, the year-over-year trend shows a decline, raising questions about its future profitability. Additionally, the average net debt of $75.38 billion necessitates further scrutiny regarding its implications for financial flexibility. The debt-to-equity ratio of 1.62 indicates a high level of financial risk, suggesting that AAPL may face challenges during economic downturns. On a more positive note, the current ratio of 1.35 reflects a healthy liquidity position, indicating that the company can comfortably cover its short-term liabilities. However, the cash to total assets ratio of 0.09 is relatively low, highlighting limited financial flexibility and potential vulnerability to economic shocks.
In terms of valuation, the forward P/E ratio of 32.94 suggests that the stock may be overvalued, as it exceeds the typical threshold of 25. Similarly, the price-to-sales ratio of 8.73 is significantly above the industry average, further indicating potential overvaluation.
When examining growth and profitability, AAPL has experienced a year-over-year revenue decline of 5.48%, which could negatively affect the stock price. However, the company maintains an impressive operating margin of 100.00%, demonstrating efficient operations and effective cost control. Additionally, a net profit margin of 25.00% reflects AAPL’s strong ability to generate profits after accounting for all expenses.
Regarding shareholder information, the average ordinary shares outstanding is 15.44 billion, which raises concerns about potential dilution if the number fluctuates significantly. On a positive note, stock repurchases totaling $81.32 billion signal a commitment to reducing the number of shares outstanding, which may enhance earnings per share.
The income statement reveals a troubling trend with declining revenue growth and net income, which raises concerns about the company’s future profitability. Nevertheless, the strong profit margins indicate that AAPL can still generate profits effectively despite these challenges.
From a balance sheet perspective, the debt-to-equity ratio of 1.62 raises alarms about financial risk and the company’s ability to withstand economic downturns. However, the average tangible book value of $67.48 billion suggests a solid foundation for the company.
In terms of cash flow, average capital expenditures of $10.02 billion indicate that AAPL is investing in growth and expansion. Furthermore, positive net cash from financing activities of $22.31 billion suggests that the company is raising capital, which could be utilized for growth initiatives or debt reduction.
Overall, while AAPL exhibits strong indicators of profitability and operational efficiency, the declining revenue and high debt levels raise significant concerns about its future performance. Therefore, the recommendation for AAPL stock is neutral at this time. Investors should carefully consider these factors before making any investment decisions.
Financial Health
🔴 Net Income for the most recent period was $21.44 billion, but the year-over-year net income trend shows a decrease, raising concerns about future profitability.
🔴 The average net debt stands at $75.38 billion, which warrants further investigation into its impact on financial flexibility.
🔴 The Debt-to-Equity Ratio of 1.62 indicates a high level of financial risk, suggesting potential challenges in economic downturns.
🟢 The Current Ratio of 1.35 indicates a healthy liquidity position, suggesting the company can cover its short-term liabilities comfortably.
🔴 The Cash to Total Assets Ratio of 0.09 is relatively low, indicating limited financial flexibility and vulnerability to economic shocks.
Valuation
🔴 The Forward P/E ratio of 32.94 suggests potential overvaluation, as it is above the typical threshold of 25.
🔴 The Price-to-Sales Ratio of 8.73 also indicates potential overvaluation, as it is significantly above the industry average.
Growth and Profitability
🔴 Year-over-year revenue growth of -5.48% indicates a decline in revenue, which could negatively impact the stock price.
🟢 Operating Margin of 100.00% suggests efficient operations and good cost control.
🟢 Net Profit Margin of 25.00% reflects the company’s strong ability to generate profits after all expenses.
Shareholder Information
🔴 The average ordinary shares outstanding is 15.44 billion, which could indicate dilution concerns if the number fluctuates significantly.
🟢 Stock repurchases of $81.32 billion can be a positive signal as it reduces the number of shares outstanding and may boost earnings per share.
Income Statement
🔴 The decline in revenue growth and net income trend raises concerns about the company’s future profitability.
🟢 The strong profit margins indicate that the company is still able to generate profits effectively despite the revenue decline.
Balance Sheet
🔴 The Debt-to-Equity Ratio of 1.62 raises concerns about financial risk and the ability to withstand economic downturns.
🟢 The Average Tangible Book Value of $67.48 billion represents the net worth of the company, indicating a solid foundation.
Cashflow
🟢 Average Capital Expenditures of $10.02 billion suggest the company is investing in growth and expansion.
🟢 Positive net cash from financing activities of $22.31 billion indicates the company is raising capital, which could be used for growth or debt reduction.
Overall, while there are strong indicators of profitability and operational efficiency, the declining revenue and high debt levels raise concerns about the company’s future performance. Therefore, the recommendation is neutral at this time.
AAPL News Analysis
A mixed outlook for Apple Inc. (AAPL) as various reports present both challenges and opportunities.
Summary of AAPL news indicates a blend of positive and negative sentiments surrounding the company’s performance and future prospects. While there are concerns regarding iPhone demand and preorders, there are also positive developments in AI integration and potential partnerships that could enhance growth.
🟢 Apple Inc. (NASDAQ:AAPL)’s iPhone Upgrade Cycle: Will AI Boost Sales? – The article discusses the potential for AI to enhance iPhone sales, suggesting that technological advancements could drive consumer interest and upgrades.
🔴 Apple iPhone Demand Softer Year Over Year, UBS Says – UBS reports a decline in iPhone demand compared to the previous year, indicating potential challenges in maintaining sales momentum.
🟢 Magnificent Seven Stocks: Nvidia Stock Falls; Apple Rallies – This report highlights that while Nvidia is struggling, Apple is experiencing a rally, suggesting investor confidence in AAPL amidst market fluctuations.
🔴 Is Apple Stock A Buy Amid Reports Of Lackluster iPhone 16 Preorders? – Concerns are raised regarding the preorders for the iPhone 16, which may reflect a lack of consumer enthusiasm and could impact future sales.
🟢 Apple Intelligence will support German, Italian, Korean, Portuguese, and Vietnamese in 2025 – The expansion of language support for Apple Intelligence indicates a commitment to enhancing user experience and could attract a broader customer base.
🟢 JPMorgan Reportedly in Talks With Apple for Credit Card Partnership – A potential partnership with JPMorgan could open new revenue streams for Apple, enhancing its financial services segment.
🔴 Apple Inc. (AAPL): Best Long-Term Stock to Buy According To Warren Buffett – While Buffett’s endorsement is positive, the context of the report suggests that current market conditions may not favor immediate investment.
AAPL Holders Analysis
The financial health of AAPL is generally positive, but there are some cautionary signals that investors should consider.
🟢 AAPL has a **high institutional ownership** at **60.88%**, indicating strong interest from large investors, which typically supports stock stability and growth. Major holders like Vanguard and Blackrock show confidence in the company’s future.
🟡 The **low insider ownership** at **2.70%** suggests that management may not have as much skin in the game, which could lead to less alignment with shareholder interests. This is common in larger companies but can be a red flag for some investors.
🟢 The **number of institutional holders** is substantial at **6498**, indicating a diversified ownership base that can help mitigate volatility.
🟡 Recent **insider transactions** show a mix of sales and purchases, with more sales than purchases in the last six months. This could indicate a lack of confidence among insiders, but it is also important to note that some sales may be for personal financial planning rather than a negative outlook on the company.
🔴 The **recent performance** of AAPL stock has been somewhat volatile, with fluctuations that could concern short-term investors.
AAPL Analyst Ratings
The analyst ratings for AAPL are predominantly positive, with a significant number of analysts recommending either a buy or strong buy. Over the past month, there have been 11 strong buy ratings, 21 buy ratings, 6 hold ratings, and no sell or strong sell ratings. This indicates a strong bullish sentiment among analysts. 🟢
The recent upgrades from firms like Evercore ISI Group and Wedbush, both maintaining an outperform rating, further bolster this positive outlook. Additionally, the consistent performance and innovation from Apple, particularly in its product lines and services, contribute to a favorable market perception.
Considering the current analyst ratings and the overall positive sentiment towards AAPL, it is likely that the stock will perform well in the next month. The high confidence level suggests a strong belief in this forecast, with potential price targets indicating a rise of approximately 5-10% based on historical performance trends and market conditions.
AAPL Economic Analysis
Based on the US economic and market data:
🟢 The **unemployment rate** has increased slightly to **4.3%**, but it remains relatively low, indicating a stable labor market. This can support consumer spending, which is crucial for Apple’s product sales.
🟢 **Retail sales** have shown an increase to **627,510**, suggesting that consumers are willing to spend, which is positive for Apple as it relies heavily on consumer electronics sales.
🟡 The **CPI** remains stable at **314.540**, indicating that inflation is under control. However, the Federal Reserve’s interest rate decisions could still impact growth stocks like Apple.
🔴 The **monthly treasury yield** has increased slightly to **4.25%**, which could lead to higher borrowing costs for consumers and businesses, potentially affecting Apple’s sales in the long run.
🟢 Apple’s strong fundamentals, including a **market cap of over $3.36 trillion** and a **trailing PE ratio of 33.70**, suggest that the company is well-positioned to weather economic fluctuations.
In the next month, I expect AAPL to trade between **$215 and $230**, with potential upward momentum if consumer spending continues to rise and if the tech sector rebounds. The current price of **$221.39** is near the middle of this range, indicating a potential for growth.
Overall, while there are some concerns regarding interest rates, the positive consumer spending data and Apple’s strong market position support a **buy** recommendation.
Disclaimer
Investors may consider the AI predictions and news summaries as one factor in their investment decisions alongside their own research and risk tolerance.


