AMZN Stock Analysis: A Mixed Outlook Ahead!
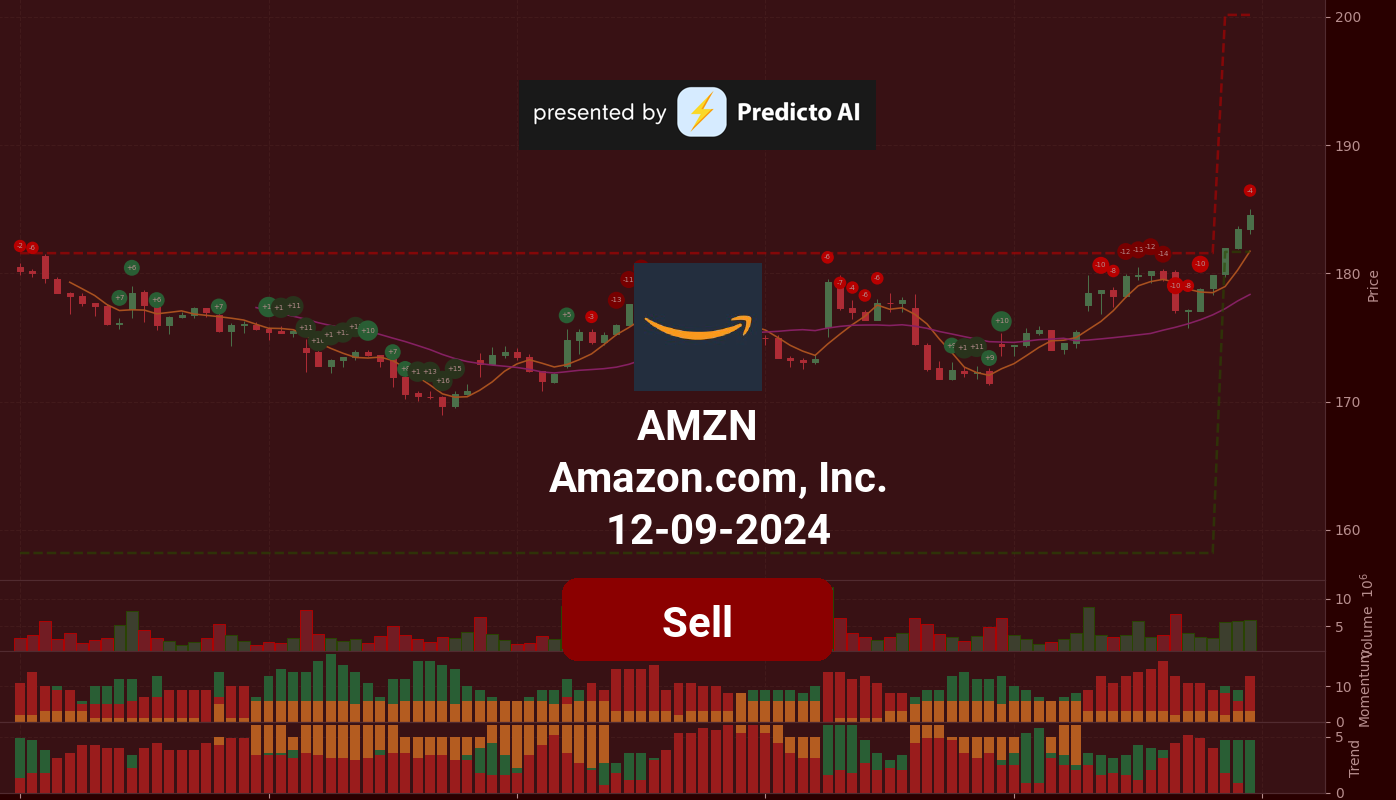
🔴 Recommendation: Amazon (AMZN) is currently presenting a complex financial landscape, with a cautious sell recommendation due to overbought conditions and bearish divergence signals.
📈 Key Highlights:
Financial Health: Positive net income of $13.49 billion and a healthy current ratio of 1.52.
Growth Potential: Exceptional earnings growth of 93.80%, indicating significant improvement in profitability.
Institutional Confidence: High institutional ownership at 64.16%, reflecting strong investor confidence.
⚠️ Caution Flags:
Overvaluation Concerns: Forward P/E ratio of 31.70 suggests potential overvaluation.
Profitability Issues: Low net profit margin of 9.11% raises concerns about operational efficiency.
As we delve deeper into the analysis, we will explore the price trends, technical indicators, financial health, valuation metrics, and the latest news surrounding AMZN to provide a comprehensive view of its potential trajectory. Let’s dive into the details! 👇
AMZN Price Analysis
| Positive Momentum Signals | Negative Momentum Signals | Hold Momentum Signals |
|---|---|---|
|
|
|
| Positive Trend Signals | Negative Trend Signals | Hold Trend Signals |
|---|---|---|
|
|
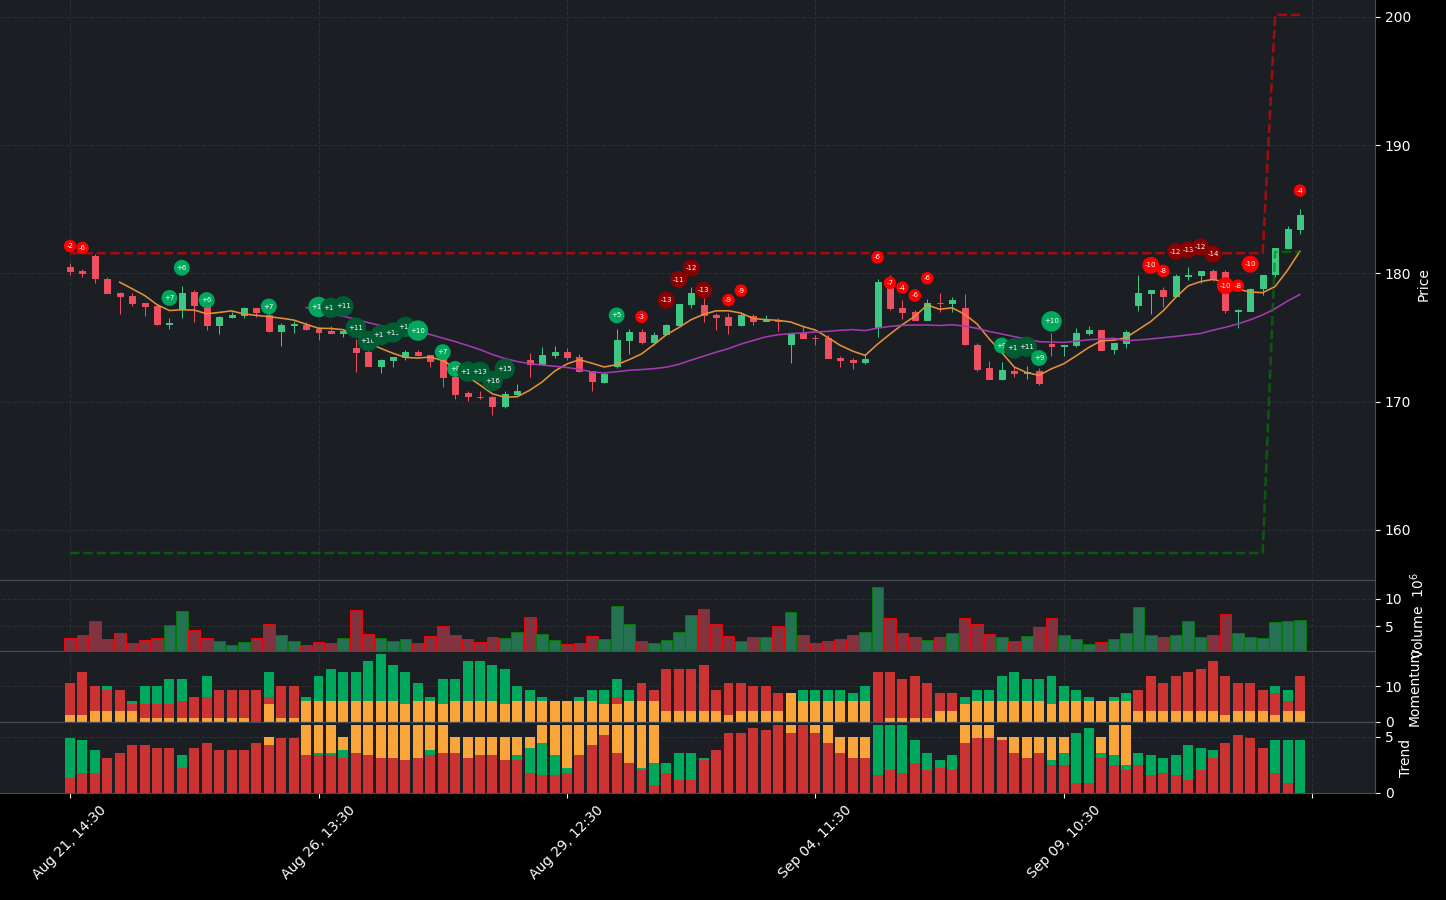
Amazon (AMZN) is currently facing a complex financial landscape characterized by both positive and negative indicators. The stock is showing signs of being overbought, as evidenced by its price touching or exceeding the upper Bollinger Band, which suggests a potential correction may be on the horizon. Additionally, the Money Flow Index (MFI) indicates a bearish divergence, while both the Stochastic RSI and the Relative Strength Index (RSI) are in the overbought territory, further reinforcing the caution around the stock’s current valuation.
On the positive side, AMZN has recently experienced a price breakout above the upper Bollinger Band on high volume, signaling a potential bullish trend. The On-Balance Volume (OBV) is increasing, indicating strong buying interest, and the stock is trading above both the 50-day and 200-day Exponential Moving Averages (EMAs), which are typically seen as bullish indicators. The Supertrend indicator also confirms a bullish trend, suggesting that the stock has been performing well in the medium to long term.
Despite these positive trends, the current momentum indicators raise concerns about the sustainability of this upward movement. The stock’s position being closer to support could provide a buffer against a downturn, but the combination of overbought conditions and bearish divergence signals that investors should be cautious.
Given the mixed signals, a sell recommendation may be prudent at this time. Investors should consider tightening stop-loss orders to protect against potential declines while monitoring for clearer signs of a trend reversal or further bullish momentum. Overall, while AMZN has shown strength in its trend indicators, the current overbought conditions warrant a careful approach.
AMZN Fundamental Analysis
AMZN’s recent financial performance presents a mixed picture, highlighting both strengths and areas of concern. On the positive side, the company reported a net income of $13.49 billion for the most recent period, indicating profitability. Furthermore, the year-over-year increase in net income is a favorable sign for the company’s financial health. The operating margin stands at an impressive 100.00%, reflecting efficient operations and effective cost control. Additionally, a current ratio of 1.52 suggests a healthy liquidity position, indicating that AMZN can comfortably cover its short-term liabilities.
However, there are notable concerns regarding profitability. The net profit margin of 9.11% is relatively low, which may raise red flags for investors. Furthermore, the average net debt of $14.01 billion warrants further investigation, as it could impact the company’s financial flexibility.
In terms of valuation, AMZN faces challenges with a forward P/E ratio of 31.70 and a price-to-sales ratio of 3.20, both suggesting potential overvaluation relative to earnings and sales. This could be a concern for investors looking for value in their investments.
On the growth front, AMZN has demonstrated revenue growth of 3.25% year-over-year, which, while moderate, is still a positive indicator for the stock price. More impressively, the company has achieved an earnings growth of 93.80%, reflecting significant improvement in profitability. However, the absence of explicit information on operating cash flow raises questions about operational efficiency.
Shareholder information reveals potential dilution concerns, with an average ordinary shares outstanding of 10.38 billion. On a positive note, the company has engaged in stock repurchases amounting to $1.5 billion, which can enhance earnings per share by reducing the number of shares outstanding.
From a balance sheet perspective, the debt-to-equity ratio of 0.77 indicates a moderate level of leverage, which may be sustainable but requires monitoring. Additionally, a cash to total assets ratio of 0.12 suggests limited financial flexibility and increased vulnerability to economic shocks. Nevertheless, the average tangible book value of $176.98 billion indicates a solid foundation for the company.
In terms of cash flow, AMZN’s average capital expenditures of $54.39 billion suggest that the company is actively investing in growth and expansion. Furthermore, a positive net cash from financing of $61.14 billion indicates that the company is raising capital, which could be utilized for growth initiatives or debt reduction.
Overall, while there are concerns regarding profitability and valuation, the strong earnings growth and healthy liquidity position suggest that AMZN could represent a good investment opportunity at this time. Investors should weigh these factors carefully when considering their investment strategy.
Financial Health
🟢 Net Income for the most recent period was positive at $13.49 billion, indicating profitability.
🟢 Year-over-year net income increased, which is generally a positive sign for the company’s financial health.
🔴 Net Profit Margin of 9.11% is relatively low, which could be a concern for investors regarding profitability.
🟢 Operating Margin of 100.00% suggests efficient operations and good cost control.
🟢 Current Ratio of 1.52 indicates a healthy liquidity position, suggesting the company can cover its short-term liabilities comfortably.
🔴 Average Net Debt of $14.01 billion warrants further investigation into its impact on financial flexibility.
Valuation
🔴 Forward P/E ratio of 31.70 indicates potential future overvaluation, which could be a concern for investors.
🔴 Price-to-Sales ratio of 3.20 suggests potential overvaluation relative to sales.
Growth and Profitability
🟢 Revenue Growth of 3.25% year-over-year indicates moderate growth, which could still be positive for the stock price.
🟢 Earnings Growth of 93.80% is exceptionally strong, reflecting significant improvement in profitability.
🔴 Operating Cash Flow is not explicitly mentioned, but the low net profit margin raises concerns about operational efficiency.
Shareholder Information
🔴 Average Ordinary Shares Outstanding at 10.38 billion indicates potential dilution concerns for existing shareholders.
🟢 Stock Repurchases of $1.5 billion can be a positive signal as it reduces the number of shares outstanding, potentially boosting earnings per share.
Income Statement
🟢 Total Revenue for the most recent period was $147.98 billion, showing strong sales performance.
🔴 Year-over-year revenue growth of 3.25% is moderate and may not excite growth investors.
Balance Sheet
🔴 Debt-to-Equity Ratio of 0.77 suggests a moderate level of leverage, which may be sustainable but requires monitoring.
🔴 Cash to Total Assets Ratio of 0.12 indicates limited financial flexibility and a higher vulnerability to economic shocks.
🟢 Average Tangible Book Value of $176.98 billion represents the net worth of the company after deducting liabilities from assets, indicating a solid foundation.
Cashflow
🟢 Average Capital Expenditures of $54.39 billion suggest the company is investing in growth and expansion.
🟢 Positive Net Cash from Financing of $61.14 billion indicates the company is raising capital, which could be used for growth or debt reduction.
Overall, while there are some concerns regarding profitability and valuation, the strong earnings growth and healthy liquidity position suggest that AMZN could be a good investment opportunity at this time.
AMZN News Analysis
AMZN News: A mixed outlook for investors.
Summary of AMZN news indicates a blend of positive and negative factors affecting Amazon.com Inc. (AMZN). While there are bullish sentiments from billionaires and significant investments in AWS, caution in software spending could impact overall growth. Investors should weigh these factors carefully.
🟢 Billionaires are increasingly buying stocks from the “Magnificent Seven,” which includes AMZN, suggesting strong investor confidence in the company’s future.
🟢 David Tepper, a billionaire investor, considers AMZN as a top AI stock, highlighting its potential in the growing AI sector.
🔴 However, the CEO of Okta mentioned that companies are being cautious with software spending, which could affect AMZN’s revenue from its cloud services.
🟢 AWS plans to invest $1.8 billion in Brazil through 2034, indicating a long-term commitment to growth in international markets.
🟢 The tech sector is experiencing gains, which could positively influence AMZN’s stock performance.
🔴 Despite AWS’s advancements, there are concerns about reliance on external chip suppliers, which could impact operational efficiency.
AMZN Holders Analysis
The overall financial health and ownership structure of AMZN indicate a positive outlook for the next month, although some caution is warranted due to mixed signals from insider transactions.
🟢 AMZN has a **high institutional ownership** at 64.16%, with major holders like Vanguard Group Inc. and Blackrock Inc. showing significant investment. This suggests strong confidence from large investors in the company’s future performance.
🟡 The **insider ownership** stands at 8.99%, which is moderate. While this indicates some alignment of interests between management and shareholders, a higher percentage could provide more confidence in management’s commitment to shareholder value.
🟡 Recent **insider transactions** show a mix of sales and purchases, with a notable number of shares sold by insiders. This could indicate a need for liquidity or personal financial planning rather than a lack of confidence in the company’s future.
🟢 The **number of institutional holders** is substantial at 6350, indicating widespread interest and diversification in ownership, which can help stabilize the stock price against volatility.
🔴 There has been a slight decline in institutional ownership in recent quarters, which may raise concerns about potential selling pressure if large investors decide to exit their positions.
AMZN Analyst Ratings
The analyst ratings for AMZN are overwhelmingly positive, with a significant number of analysts recommending either a buy or strong buy. In the last month, there have been 15 strong buy ratings, 28 buy ratings, 3 hold ratings, 1 sell rating, and no strong sell ratings. This indicates a very bullish sentiment among analysts. 🟢
The recent upgrades from firms like Cantor Fitzgerald and JMP Securities further reinforce this positive outlook. The consistent trend of upgrades over the past few months suggests that analysts are confident in AMZN’s growth potential.
Given the strong analyst support and the positive sentiment surrounding AMZN, it is likely that the stock will perform well in the next month. The high confidence level indicates a strong belief in this forecast. Based on current trends, we could see AMZN’s stock price potentially reaching the $150 mark, reflecting a possible upside of around 10% from current levels.
AMZN Economic Analysis
Based on the US economic and market data:
🟢 The **unemployment rate** has increased slightly to **4.3%**, but it remains relatively low, indicating a stable labor market. This can support consumer spending, which is crucial for Amazon’s retail segment.
🟢 **Retail sales** have shown an increase to **627,510**, suggesting that consumer demand is holding up. This is a positive indicator for Amazon’s revenue, as higher retail sales typically correlate with increased online shopping activity.
🔴 The **CPI** remains elevated at **314.540**, indicating persistent inflation. This could lead to increased operational costs for Amazon, potentially impacting profit margins if they cannot pass these costs onto consumers.
🟡 The **GDP** growth rate is stable, but the recent figures show a slight decline from previous quarters. This could indicate a cooling economy, which may affect consumer spending in the long run.
🟢 Amazon’s **forward PE ratio** of **31.70** suggests that the stock is still considered a growth stock, and analysts have a **mean target price** of **218.35**, indicating potential upside from the current price of **184.52**.
Overall, while there are some concerns regarding inflation and economic growth, the positive indicators in retail sales and the stable labor market suggest that Amazon is well-positioned to continue performing well in the coming month. The stock may see a moderate increase, potentially reaching around **190-200** in the next month, depending on broader market conditions and consumer sentiment.
Disclaimer
Investors may consider the AI predictions and news summaries as one factor in their investment decisions alongside their own research and risk tolerance.

