APD Stock Analysis: A Mixed Outlook Ahead!
🔴 Recommendation: APD is presenting a neutral stance with a blend of positive and negative indicators that warrant careful consideration.
📈 Key Highlights:
Financial Health: Positive net income of $696.6 million and a healthy current ratio of 1.15 indicate profitability and liquidity.
Momentum Indicators: The WaveTrend indicator shows an oversold condition, hinting at a potential price reversal.
Institutional Support: High institutional ownership at 88.90% reflects strong confidence from large investors.
⚠️ Caution Flags:
High Debt Levels: Average net debt stands at $9.87 billion, raising concerns about financial flexibility.
Revenue Growth: Year-over-year revenue growth of only 1.89% suggests moderate growth potential.
Market Volatility: Ongoing geopolitical tensions could impact commodity prices and APD’s operations.
Let’s dive into the details as we break down the price trends, indicators, financial health, valuation metrics, and more 👇
APD Price Analysis
| Positive Momentum Signals | Negative Momentum Signals | Hold Momentum Signals |
|---|---|---|
|
|
| Positive Trend Signals | Negative Trend Signals | Hold Trend Signals |
|---|---|---|
|
|
|
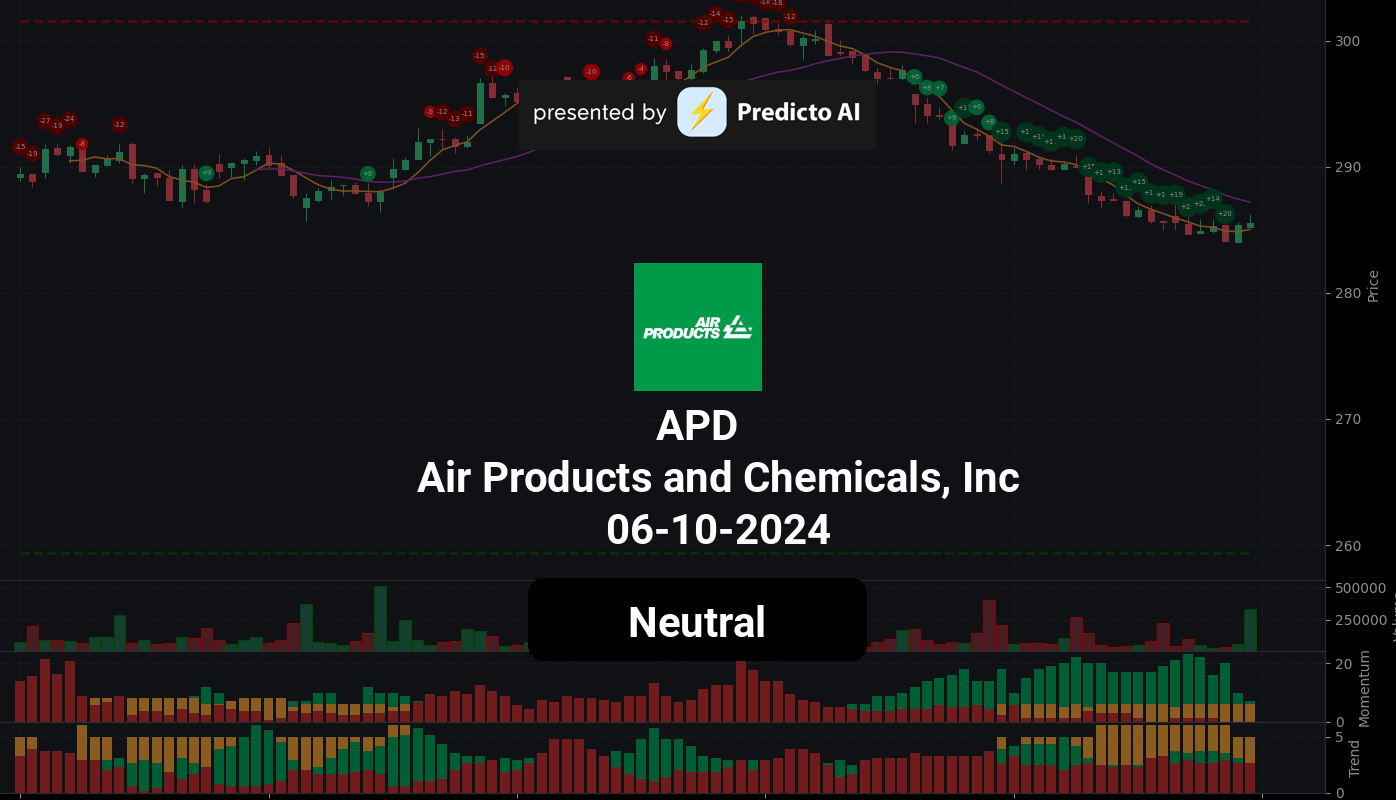
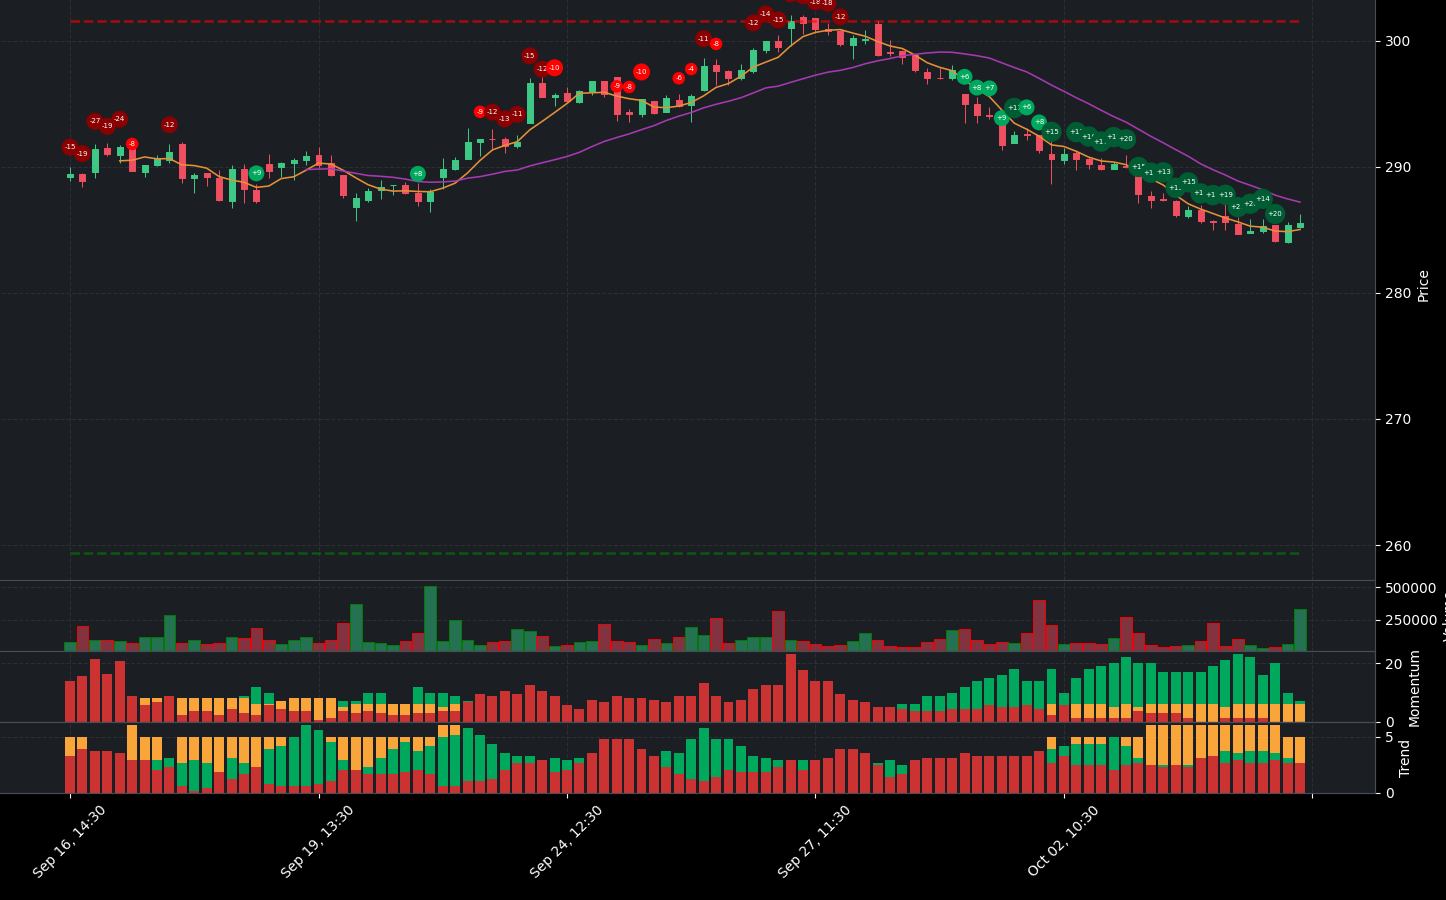
APD stock presents a complex financial picture, characterized by both positive and negative indicators. Currently, the stock is experiencing a neutral price trend, which suggests a lack of clear direction in the market. However, there are some positive momentum indicators to consider, notably the WaveTrend indicator, which is showing an oversold condition, indicating a potential bottom and possible reversal in price.
On the trend front, the On-Balance Volume (OBV) is increasing, supported by high volume activity, which typically signals strong buying interest. This could be a positive sign for investors looking for potential upward movement in the stock. However, caution is warranted as the price remains below the Middle Band and is currently in a downtrend. The stock is also below both the 50-day and 200-day Exponential Moving Averages (EMAs), indicating a bearish trend that is strengthening.
The Supertrend indicator further confirms the bearish outlook, as the price is below the Supertrend line. This combination of indicators suggests that while there may be some short-term buying opportunities due to oversold conditions, the overall trend remains negative.
Given these mixed signals, investors should approach APD stock with caution. The potential for a rebound exists, but the prevailing bearish trends and the stock’s position relative to key moving averages indicate that a hold or cautious buy strategy may be more prudent until clearer signs of a trend reversal emerge.
APD Fundamental Analysis
APD’s recent financial performance presents a mixed picture, highlighting both strengths and weaknesses that investors should carefully consider.
On the positive side, the company reported a net income of $696.6 million for the most recent period, indicating profitability. Additionally, the year-over-year increase in net income is a favorable sign for the company’s financial health. The current ratio of 1.15 suggests a healthy liquidity position, indicating that APD should be able to cover its short-term liabilities comfortably. Furthermore, the operating margin of 100.00% and a net profit margin of 23.33% reflect efficient operations and the company’s ability to generate profits after all expenses.
However, several concerning factors warrant caution. The average net debt of $9.87 billion is high, which could impact financial flexibility. The debt-to-equity ratio of 0.93 indicates a moderate level of leverage, but this may still pose risks depending on the company’s industry and profitability. Additionally, the cash to total assets ratio of 0.06 suggests limited financial flexibility and a higher vulnerability to economic shocks.
Valuation metrics also raise red flags. The price-to-sales ratio of 5.24 suggests potential overvaluation, while the forward P/E of 21.35 indicates that the stock is priced for growth that may not be justified given the revenue growth trends. Notably, the year-over-year revenue growth of -1.60% indicates a decline in revenue, which is a warning sign for investors.
Moreover, the company is facing challenges with negative free cash flow of -$2.74 billion, which raises concerns about its ability to fund operations and growth. Although average capital expenditures of $3.13 billion suggest that the company is investing in growth and expansion, the negative free cash flow could limit financial flexibility and the ability to invest in future opportunities.
In summary, while APD demonstrates strong profitability and efficient operations, the high debt levels, potential overvaluation, and declining revenue growth present significant concerns. Investors should adopt a neutral stance and thoroughly evaluate the company’s ability to navigate these challenges before making any investment decisions.
Financial Health
🟢 Net Income for the most recent period was positive at $696.6 million, indicating profitability.
🟢 Year-over-year net income increased, which is a positive sign for the company’s financial health.
🔴 Average Net Debt is high at $9.87 billion, warranting further investigation into its impact on financial flexibility.
🟡 Debt-to-Equity Ratio of 0.93 suggests a moderate level of leverage, which may be sustainable depending on the company’s industry and profitability.
🟢 Current Ratio of 1.15 indicates a healthy liquidity position, suggesting the company should be able to cover its short-term liabilities comfortably.
🔴 Cash to Total Assets Ratio is low at 0.06, indicating limited financial flexibility and a higher vulnerability to economic shocks.
Valuation
🔴 Price-to-Sales Ratio is high at 5.24, suggesting potential overvaluation.
🟡 Forward PE of 21.35 indicates that the stock is priced for growth, but it may not be justified given the revenue growth trends.
Growth and Profitability
🟢 Operating Margin of 100.00% suggests efficient operations and good cost control.
🟢 Net Profit Margin of 23.33% reflects the company’s ability to generate profits after all expenses.
🔴 Revenue Growth (YoY) was only 1.89%, which suggests moderate growth and could be a concern for future performance.
🔴 Negative free cash flow of -$2.74 billion raises concerns about the company’s ability to fund operations and growth.
Shareholder Information
🟡 Average Ordinary Shares Outstanding at 222,254,013 shares indicates a stable shareholder base.
🟡 Average Treasury Shares of 27,201,570 shares could indicate management’s confidence in the company’s future prospects, but further analysis is needed.
Income Statement
🟢 Total revenue for the most recent period was $2.99 billion, showing a solid revenue base.
🔴 Year-over-year revenue growth was -1.60%, indicating a decline in revenue, which is a warning sign for investors.
🟢 Profit Margins are strong, with a net profit margin of 21.24%, reflecting the company’s ability to generate profits after expenses.
Balance Sheet
🔴 Average Total Debt is high at $12.55 billion, which requires further analysis to understand its impact on financial health.
🟡 Average Tangible Book Value of $13.45 billion indicates a solid net worth after deducting liabilities from assets.
Cashflow
🟢 Average Capital Expenditures of $3.13 billion suggest the company is investing in growth and expansion.
🔴 Negative free cash flow could limit the company’s financial flexibility and ability to invest in future opportunities.
Overall, while the company shows strong profitability and efficient operations, concerns about high debt levels, potential overvaluation, and declining revenue growth warrant a neutral stance.
APD News Analysis
A mixed outlook for Air Products and Chemicals, Inc. (APD) with significant developments that could influence stock performance.
Summary of APD news indicates a blend of positive and negative factors affecting the company. The substantial investment by activist Mantle Ridge and the completion of the LNG business sale to Honeywell are strong positives. However, ongoing geopolitical tensions may impact commodity prices, which could affect APD’s operations. Investors should weigh these factors carefully.
🟢 Activist Mantle Ridge has acquired over $1 billion stake in Air Products, signaling strong confidence in the company’s future performance.
🟢 This investment could lead to strategic changes that may enhance shareholder value.
🔴 Tensions in China and the Middle East are pushing commodities into the spotlight, which could lead to volatility in the market and affect APD’s operations.
🟢 Air Products has successfully completed the sale of its LNG business to Honeywell for $1.81 billion, which could provide the company with additional capital for growth initiatives.
🟢 The sale is expected to streamline operations and focus on core business areas, potentially leading to improved profitability.
🟢 APD stocks have hit a 52-week high, indicating strong market performance and investor confidence.
🟢 The stock has risen 21% over the past six months, driven by positive market sentiment and operational efficiencies.
APD Holders Analysis
The financial health of APD presents a mixed outlook, leading to a neutral recommendation for the next month. While there are positive aspects, there are also concerns that warrant caution.
🟢 APD has a high institutional ownership at **88.90%**, indicating strong interest from large investors, which typically suggests confidence in the company’s future performance. This level of institutional backing can provide stability to the stock price.
🟡 The **0.35% insider ownership** is very low, which may indicate a lack of confidence from company management or a high degree of external control. This could be a red flag for potential investors, as it suggests that insiders may not have significant skin in the game.
🟡 The number of institutional holders is substantial at **2112**, which reflects a diversified ownership structure. However, this also means that if a few large holders decide to sell, it could lead to increased volatility in the stock price.
🔴 Recent insider transactions show a significant amount of selling, with several executives divesting shares. This could indicate a lack of confidence in the near-term prospects of the company, which is concerning for potential investors.
🔴 The lack of insider purchases in the last six months further emphasizes the cautious sentiment among company executives. This absence of buying activity could suggest that insiders do not see immediate value in acquiring more shares.
APD Analyst Ratings
The analyst ratings for APD show a mixed sentiment, with a notable number of analysts recommending a buy. Over the past month, there have been 3 strong buy ratings, 11 buy ratings, 6 hold ratings, and no sell or strong sell ratings. This indicates a generally positive outlook among analysts. 🟡
In the last month, the upgrades from firms like Goldman Sachs and BMO Capital to buy and outperform respectively, suggest a bullish sentiment. However, the recent downgrade from Citigroup to neutral indicates some caution. 🟢
Considering the overall analyst sentiment and the lack of strong sell ratings, it is likely that APD will perform moderately well in the next month. However, the medium confidence level suggests that investors should remain vigilant for any changes in market conditions or analyst opinions.
APD Economic Analysis
Based on the US economic and market data:
🔴 The unemployment rate has increased to 4.3%, up from 4.1% in the previous month, indicating a potential slowdown in the labor market which could negatively impact consumer spending and overall economic growth.
🟡 Retail sales have shown a modest increase, but the growth rate is slowing, suggesting that consumer demand may be stabilizing rather than accelerating. This could lead to stagnant revenue growth for companies like Air Products.
🟢 The GDP growth remains relatively stable, indicating that the economy is not in recession, which is a positive sign for corporate earnings in the long run.
🔴 The increase in the Monthly Treasury Yield to 4.25% may lead to higher borrowing costs, which could impact capital expenditures for companies in the specialty chemicals sector, including Air Products.
🟡 The overall market indices such as NASDAQ and S&P 500 are currently showing mixed signals, with no clear upward or downward trends, indicating uncertainty in the market.
In summary, while there are some positive indicators, the increase in unemployment and treasury yields raises concerns about future growth. Therefore, the outlook for Air Products (APD) remains neutral for the next month, with potential volatility depending on broader economic conditions.
Disclaimer
Investors may consider the AI predictions and news summaries as one factor in their investment decisions alongside their own research and risk tolerance.

