BIIB Stock Analysis: A Mixed Outlook Ahead!
🔴 Recommendation: BIIB presents a complex financial landscape with both positive and negative indicators, leading to a cautious approach for investors.
📈 Key Highlights:
Profitability: Positive net income of $583.6 million, showcasing the company’s ability to generate profits.
Growth: Year-over-year revenue growth of 7.61%, indicating moderate expansion.
Valuation: A forward P/E ratio of 11.38 suggests potential future undervaluation, making it attractive for long-term investors.
⚠️ Caution Flags:
High Debt: Average net debt stands at $4.88 billion, raising concerns about financial flexibility.
Legal Challenges: Ongoing lawsuits related to drug pricing could impact investor sentiment and stock performance.
As we delve deeper into the analysis, we will explore the price trends, momentum indicators, financial health, valuation metrics, and the latest news surrounding Biogen (BIIB) to provide a comprehensive view of its current standing and future prospects. Let’s dive into the details! 👇
BIIB Price Analysis
| Positive Momentum Signals | Negative Momentum Signals | Hold Momentum Signals |
|---|---|---|
|
|
|
| Positive Trend Signals | Negative Trend Signals | Hold Trend Signals |
|---|---|---|
|
|
|
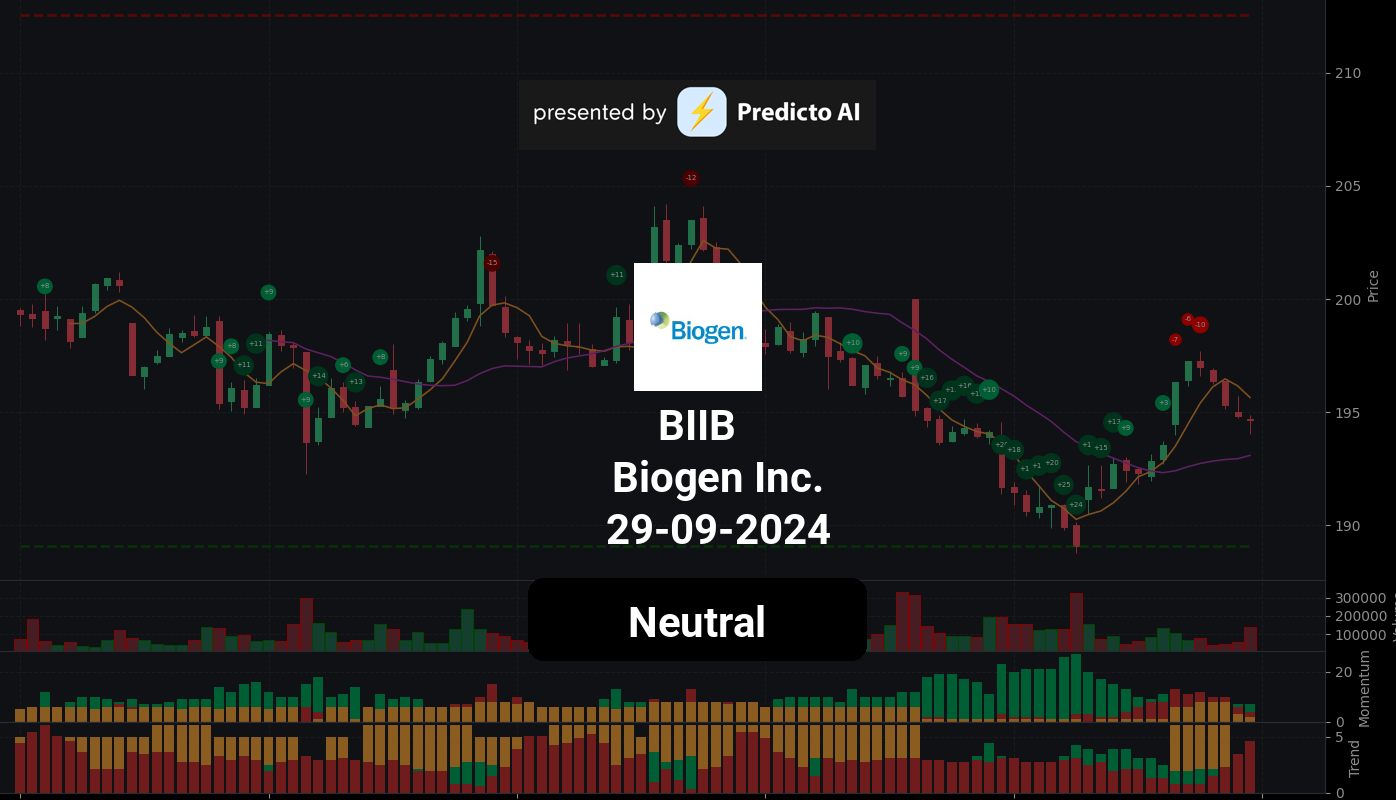
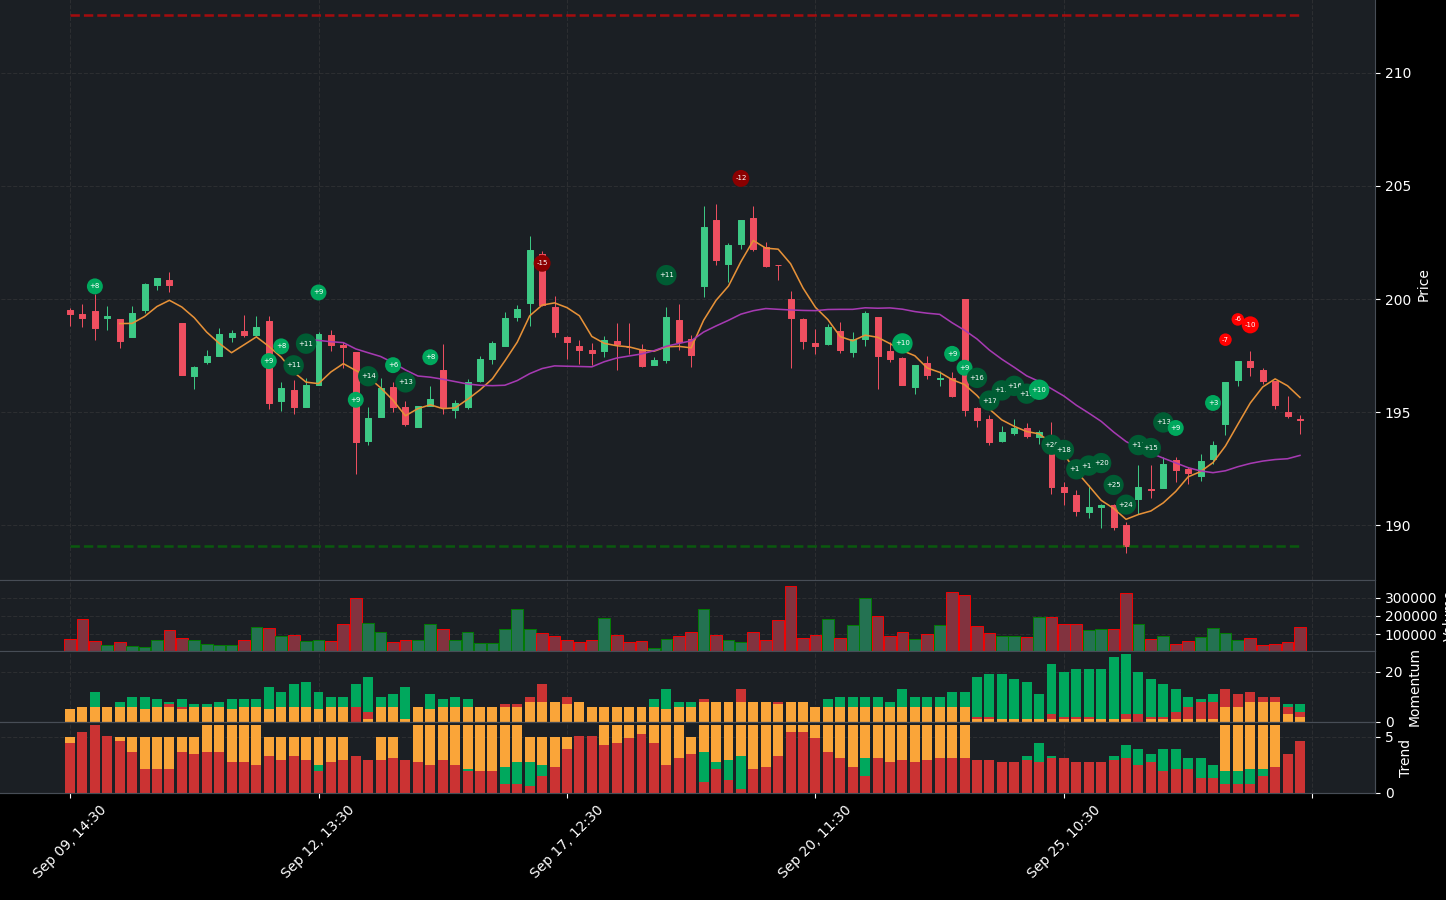
BIIB stock presents a complex financial landscape, characterized by both positive and negative indicators. Currently, the stock is trading at a neutral price level, which suggests a cautious approach is warranted.
On the positive side, BIIB shows some encouraging momentum indicators. The stock is positioned closer to support levels, which could provide a buffer against further declines. Additionally, it is trading above the middle band of its price channel, indicating an uptrend, although investors should be wary of potential overbought conditions. The stock is also above its 50-day EMA, reinforcing a bullish trend, and the Supertrend indicator confirms this bullish sentiment as the price remains above it.
However, several negative momentum and trend indicators raise concerns. The WaveTrend indicator has issued a confirmed sell signal, suggesting a potential reversal in momentum. The On-Balance Volume (OBV) is decreasing, indicating that high volume is not supporting price increases, which could signal weakening demand. Furthermore, the stock is trading below its 200-day EMA, indicating a bearish trend that is strengthening. The MACD has also shown a negative histogram crossover, further supporting the bearish outlook.
Given these mixed signals, investors should exercise caution. While there are some bullish indicators, the presence of significant bearish trends and weakening momentum suggests that the stock may face challenges ahead. A hold or sell recommendation may be prudent until clearer signals of recovery or growth emerge.
BIIB Fundamental Analysis
BIIB’s recent financial performance presents a mixed but generally positive outlook for investors. The company demonstrates strong profitability, with a net income of $583.6 million for the most recent period, indicating effective operations and a solid ability to generate profits. Additionally, the year-over-year increase in net income is a favorable sign for the company’s financial health.
However, there are notable concerns regarding the company’s financial structure. The average net debt stands at a high $4.88 billion, which necessitates further scrutiny regarding its impact on financial flexibility. Coupled with a debt-to-equity ratio of 3.67, these figures raise alarms about the company’s financial risk profile and its capacity to weather economic downturns. Furthermore, a current ratio of 0.85 suggests potential liquidity risks, indicating challenges in meeting short-term financial obligations.
From a valuation perspective, BIIB appears to be potentially undervalued, as indicated by a forward P/E ratio of 11.38. However, the price-to-sales ratio of 2.93 is moderate, suggesting that the stock may not be significantly undervalued relative to its sales.
In terms of growth and profitability, the company reported revenue of $2.46 billion, with a year-over-year growth rate of 7.61%, reflecting moderate growth. The operating margin of 100.00% indicates exceptional operational efficiency, while a net profit margin of 23.68% showcases the company’s strong ability to generate profits after all expenses. However, an earnings growth rate of -1.70% raises concerns about future profitability.
Shareholder information reveals stability, with an average of 144.82 million ordinary shares outstanding and 23.8 million average treasury shares, which may indicate management’s confidence in the company’s future prospects through share buyback activities.
On the balance sheet, while the average tangible book value of $1.92 billion indicates a solid net worth, the high average net debt and concerning debt-to-equity ratio warrant close monitoring.
Cash flow metrics are encouraging, with positive net cash from financing activities at $1.86 billion, suggesting the company is raising capital for growth or debt reduction. The average capital expenditures of $350.3 million indicate ongoing investments in growth and expansion, while positive free cash flow of $1.27 billion provides the company with cash available for further investments, debt reduction, or dividends.
Overall, BIIB exhibits strong profitability and efficient operations, but the high debt levels and liquidity risks should be closely monitored. The positive trends in revenue and net income, along with favorable valuation metrics, support a buy recommendation. Investors should remain vigilant regarding the company’s financial structure while considering the potential for growth.
Financial Health
🟢 Net Income for the most recent period was positive at $583.6 million, showing profitability.
🟢 Year-over-year net income increased, which is generally a positive sign for the company’s financial health.
🔴 Average Net Debt is high at $4.88 billion, warranting further investigation into its impact on financial flexibility.
🔴 Debt-to-Equity Ratio of 3.67 raises concerns about the company’s financial risk profile and its ability to withstand economic downturns.
🟡 Current Ratio of 0.85 suggests a potential liquidity risk, indicating challenges in meeting short-term financial obligations.
Valuation
🟢 Forward P/E ratio of 11.38 suggests potential future undervaluation, which could make the stock attractive for investors.
🔴 Price-to-Sales Ratio of 2.93 is moderate, indicating that the stock may not be undervalued relative to its sales.
Growth and Profitability
🟢 Revenue for the most recent period was $2.46 billion, with a year-over-year revenue growth of 7.61%, suggesting moderate growth.
🟢 Operating Margin of 100.00% indicates efficient operations and good cost control.
🟢 Net Profit Margin of 23.68% reflects the company’s strong ability to generate profits after all expenses.
🔴 Earnings Growth of -1.70% indicates a slight decline in earnings, which could be a concern for future profitability.
Shareholder Information
🟢 Average Ordinary Shares Outstanding is 144.82 million, indicating a stable number of shares held by investors.
🟢 Average Treasury Shares of 23.8 million could indicate share buyback activity, signaling management’s confidence in the company’s future prospects.
Income Statement
🟢 Net Income for the most recent period was positive at $583.6 million, showing profitability.
🟢 Operating Margin of 100.00% suggests efficient operations.
🟢 Net Profit Margin of 23.68% reflects the company’s ability to generate profits after expenses.
Balance Sheet
🔴 Average Net Debt is high at $4.88 billion, warranting further investigation into its impact on financial flexibility.
🔴 Debt-to-Equity Ratio of 3.67 raises concerns about financial risk.
🟡 Current Ratio of 0.85 suggests potential liquidity risk.
🟢 Average Tangible Book Value of $1.92 billion indicates a solid net worth after deducting liabilities from assets.
Cashflow
🟢 Positive net cash from financing activities at $1.86 billion indicates the company is raising capital, which could be used for growth or debt reduction.
🟢 Average Capital Expenditures of $350.3 million suggests the company is investing in growth and expansion.
🟢 Positive free cash flow of $1.27 billion indicates the company has cash available for investments, debt reduction, or dividends.
Overall, the company shows strong profitability and efficient operations, but concerns about high debt levels and liquidity risks should be monitored closely. The positive growth in revenue and net income trends, along with a favorable valuation, support a buy recommendation.
BIIB News Analysis
Recent news surrounding Biogen (BIIB) indicates significant challenges, particularly the termination of collaborations and legal issues, which could negatively impact investor sentiment and stock performance.
Summary of news regarding Biogen (BIIB) presents a concerning outlook for investors. The termination of collaborations with Sage Therapeutics on the SAGE-324 program raises questions about Biogen’s pipeline and future growth prospects. Additionally, the company is facing legal challenges related to drug pricing, which could further strain its financial position. While there are some positive developments, such as progress in lupus treatment, the overall sentiment is overshadowed by the negative news.
🔴 Biogen (NASDAQ:BIIB) has ended its collaboration with Sage Therapeutics for the neurology candidate SAGE-324, which could hinder its product pipeline and future revenue potential.
🔴 The termination of this collaboration raises concerns about Biogen’s ability to innovate and compete in the neurology space.
🔴 Biogen has also been sued by the City of Baltimore over alleged drug pricing schemes, which could lead to financial penalties and damage to its reputation.
🟢 On a slightly positive note, Biogen’s lupus candidate has met key goals in a Phase III study, indicating some progress in its drug development efforts.
🟢 Additionally, Biogen’s stock opened higher following the positive lupus readout, suggesting some investor optimism despite the surrounding challenges.
🔴 However, the overall sentiment remains negative due to the collaboration termination and ongoing legal issues, which could lead to a decline in stock price.
BIIB Holders Analysis
The financial landscape for BIIB presents a mixed outlook, leading to a neutral recommendation for the next month. While there are positive indicators, some concerning aspects warrant caution.
🟢 BIIB has a **high institutional ownership** at **92.73%**, indicating strong interest from large investors, which typically reflects confidence in the company’s future performance. This level of institutional backing can provide stability to the stock price.
🟡 The **insider ownership** is very low at **0.17%**, suggesting a lack of confidence from company management or a high degree of external control. This could be a red flag for potential investors, as it may indicate that insiders do not have significant skin in the game.
🟡 The number of institutional holders is substantial at **1415 institutions**, which indicates a diversified ownership structure. However, this could also lead to increased volatility if these investors decide to sell en masse.
🔴 Recent **insider transactions** show a higher number of sales compared to purchases, with only **11 purchases** against **2 sales** in the last six months. This trend may suggest that insiders are not optimistic about the near-term prospects of the company.
🔴 The **insider transactions** also reveal that the majority of the shares sold were part of pre-planned stock option exercises, which could indicate a lack of confidence in the stock’s future performance.
BIIB Analyst Ratings
The analyst ratings for BIIB show a generally positive outlook, with a total of 8 strong buy ratings, 13 buy ratings, and 11 hold ratings over the last month. Notably, there have been no sell or strong sell recommendations, indicating a lack of bearish sentiment among analysts. 🟢 Recent upgrades from firms like RBC Capital and Needham reinforce this positive sentiment, suggesting that analysts expect BIIB to perform well in the near term.
In the past month, the distribution of ratings indicates a bullish sentiment, with 8 strong buy ratings and 13 buy ratings, which is a solid foundation for potential price appreciation. However, the presence of 11 hold ratings suggests that some analysts are cautious, which contributes to the medium confidence level.
🟡 Looking ahead, BIIB is likely to see moderate growth in the next month, with a potential price target increase of around 5-10% based on current analyst sentiment and market conditions. Overall, while the outlook is positive, the medium confidence level indicates that investors should remain vigilant and consider market fluctuations.
BIIB Economic Analysis
Based on the US economic and market data:
🔴 The unemployment rate has increased to 4.3%, up from 4.1% in the previous month, indicating a slight deterioration in the labor market. This could lead to reduced consumer spending, which may negatively impact Biogen’s sales of its neurological therapies.
🟡 Retail sales have shown a modest increase, but the overall growth is not robust enough to suggest a significant boost in consumer demand for Biogen’s products. The retail sales figure of 627,510 is an improvement, yet it does not strongly correlate with the healthcare sector’s performance.
🔴 The recent CPI data indicates inflationary pressures, which could lead to increased operational costs for Biogen. If inflation continues to rise, it may affect profit margins, especially given the company’s trailing profit margin of 11.98%.
🟢 On a positive note, Biogen’s pipeline for neurological therapies remains strong, with ongoing developments in Alzheimer’s and multiple sclerosis treatments. This could provide a buffer against short-term economic fluctuations.
🔴 The overall market sentiment appears cautious, with indices like the NASDAQ and S&P 500 showing volatility. This could lead to a risk-off environment where investors may shy away from biotech stocks, including Biogen.
In summary, while Biogen has a solid product pipeline, the current economic indicators suggest a cautious outlook for the next month. The stock may face headwinds due to rising unemployment and inflation, which could pressure its price. The target price range for BIIB in the next month is likely to be between 190 and 205, reflecting a potential downside from the current price of 194.67.
Disclaimer
Investors may consider the AI predictions and news summaries as one factor in their investment decisions alongside their own research and risk tolerance.

