FE Stock Analysis: A Mixed Outlook Ahead!
🔴 Recommendation: FirstEnergy (FE) is currently rated as a cautious buy, but investors should tread carefully due to conflicting indicators and significant financial concerns.
📈 Key Highlights:
Market Sentiment: The stock shows signs of potential upside with oversold conditions and increasing On-Balance Volume, indicating strong buying interest.
Analyst Upgrades: Recent upgrades from analysts, including a price target increase from Morgan Stanley, reflect a positive sentiment towards FE’s growth potential.
Operational Focus: Ongoing projects in renewable energy, such as new solar facilities, align with industry trends and could enhance long-term prospects.
⚠️ Caution Flags:
Financial Health: Declining net income and a high Debt-to-Equity Ratio of 4.32 raise serious concerns about the company’s financial stability.
Negative Cash Flow: Free Cash Flow is currently negative, indicating challenges in funding operations and growth initiatives.
Mixed Analyst Ratings: With a significant number of hold ratings, many analysts remain cautious about FE’s near-term performance.
Let’s dive into the details as we break down the price trends, indicators, financial health, valuation metrics, and more 👇
FE Price Analysis

| Positive Momentum Signals | Negative Momentum Signals | Hold Momentum Signals |
|---|---|---|
|
|
|
| Positive Trend Signals | Negative Trend Signals | Hold Trend Signals |
|---|---|---|
|
|
|
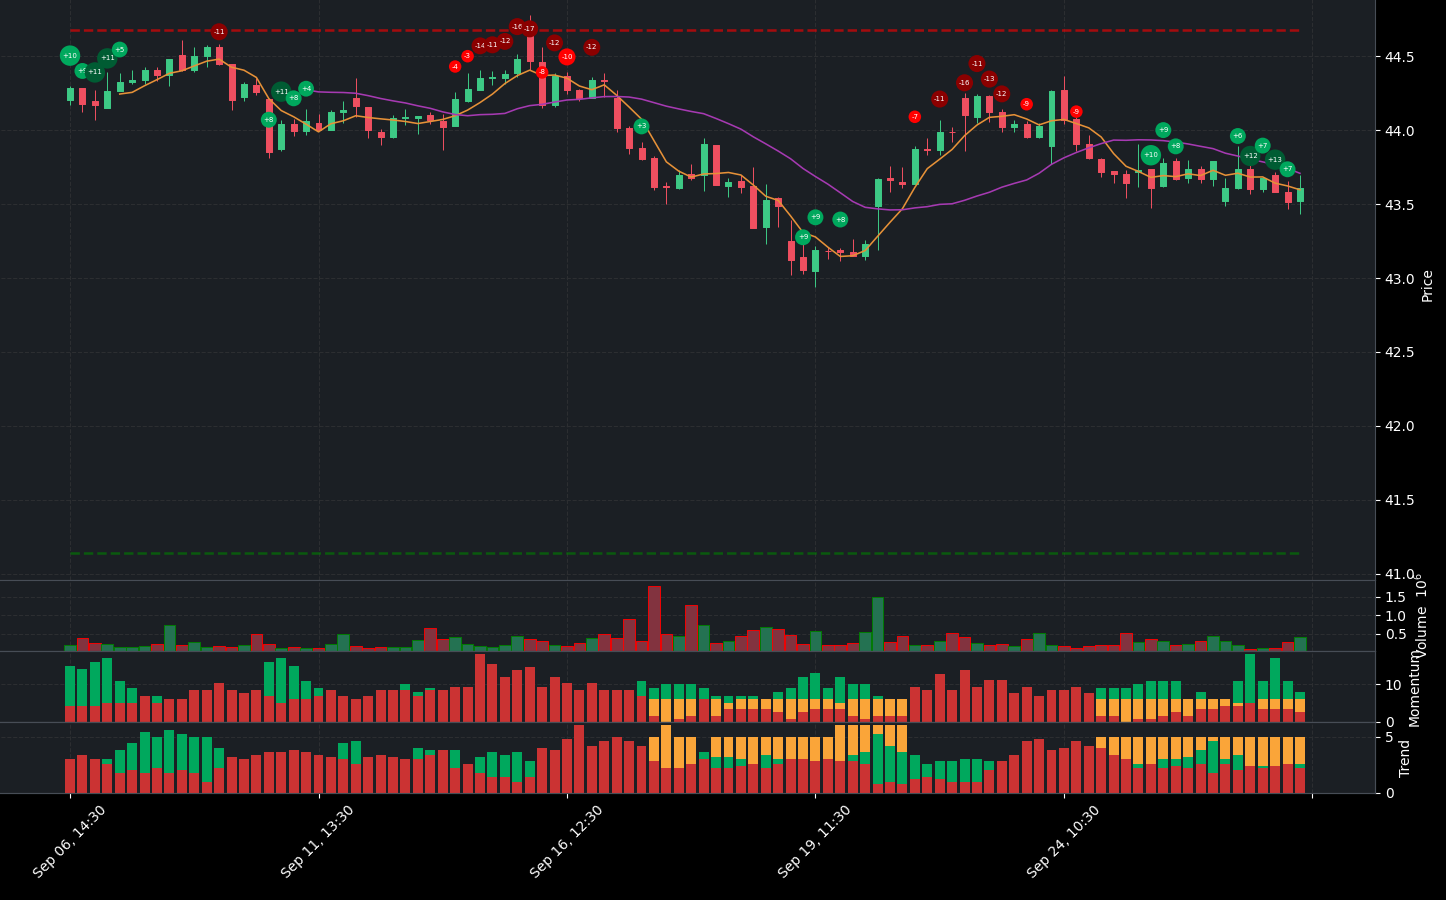
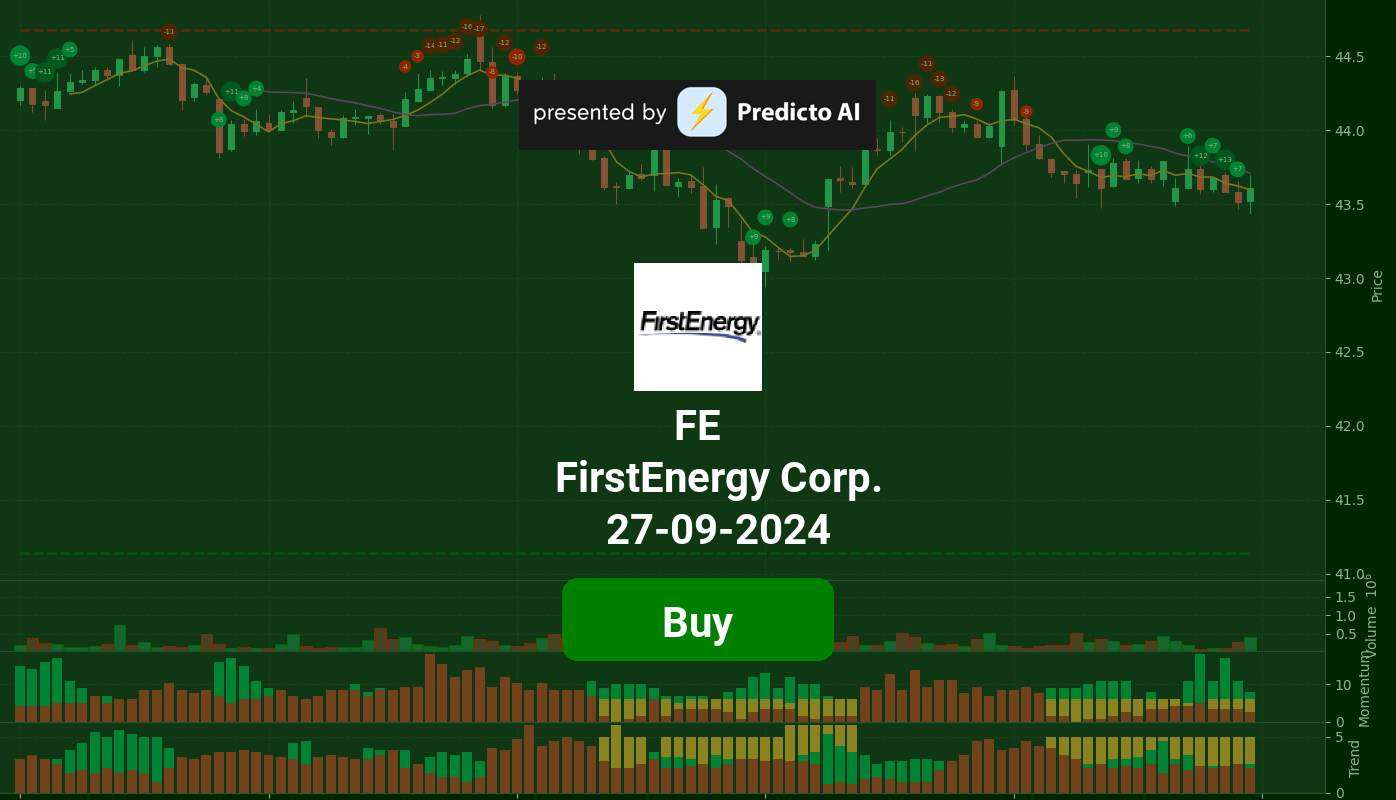
FE stock presents a complex picture for investors, characterized by both positive and negative indicators. Currently, the stock is rated as a buy, suggesting potential upside in the near term. Notably, the WaveTrend indicator shows oversold conditions, indicating a potential bottom, which could signal a buying opportunity.
However, caution is warranted due to the bearish divergence in the WaveTrend indicator, which may suggest a potential reversal in momentum. This conflicting signal highlights the need for careful consideration before making investment decisions.
On the trend front, several positive indicators are present. The On-Balance Volume (OBV) is increasing, supported by high volume, which typically indicates strong buying interest. Additionally, the stock price is currently above the 200-day Exponential Moving Average (EMA), reinforcing a bullish trend. The MACD has also shown a positive histogram crossover, further supporting the bullish outlook.
Conversely, there are significant negative trend indicators to consider. The price is below the Middle Band and above the Lower Band, indicating a downtrend, albeit in oversold conditions. Furthermore, the stock is below the 50-day EMA, which suggests a bearish trend that is strengthening. The Supertrend indicator is also bearish, with the price below the Supertrend line, adding to the cautionary signals.
In summary, while FE stock shows some promising signs, such as oversold conditions and increasing volume, the presence of bearish divergences and negative trend indicators necessitates a cautious approach. Investors may want to consider a hold strategy or closely monitor the stock for clearer signals before committing to a more aggressive position.
FE Fundamental Analysis
FE’s recent financial performance raises significant concerns for investors. The company reported a net income of $45 million for the most recent period; however, the year-over-year trend shows a troubling decrease, which casts doubt on future profitability.
The financial health of FE is alarming, highlighted by an extremely high debt-to-equity ratio of 4.32, indicating substantial financial leverage and potential risk. Additionally, the current ratio of 0.36 suggests serious liquidity issues, raising questions about the company’s ability to meet its short-term obligations. The cash to total assets ratio of only 0.01 further emphasizes limited financial flexibility and vulnerability to economic shocks.
Valuation metrics also point to potential overvaluation, with a forward P/E ratio of 15.09 and a price-to-sales ratio of 1.93, indicating that the stock may be trading at a high valuation relative to its revenue and earnings performance.
In terms of growth and profitability, FE is facing significant challenges. The revenue growth (YoY) is negative at -0.21%, indicating a decline in revenue, which could adversely affect the stock price. More concerning is the earnings growth of -80.90%, raising serious alarms about the company’s future profitability. The net profit margin of 1.37% is also low, suggesting difficulties in generating profits.
Shareholder information reveals potential dilution concerns, with an average of 574,590,297 ordinary shares outstanding and no treasury shares, indicating a lack of buybacks and possibly a lack of confidence in the stock’s future performance.
The income statement shows total revenue of $3.28 billion for the most recent period, but the negative revenue growth indicates potential challenges ahead. While the operating margin is high at 97.44%, this is overshadowed by other negative indicators, including a net interest income of -$256 million, which suggests that the company is paying more in interest on its debts than it is earning on its assets.
On the balance sheet, the average net debt of $24.09 billion raises further concerns about financial flexibility. The high debt-to-equity ratio and low current ratio indicate potential liquidity issues that could hinder the company’s operations.
Cash flow analysis reveals a troubling picture, with free cash flow being negative at -$2.05 billion, raising serious concerns about the company’s ability to fund operations and invest in growth. Although the average capital expenditures of $2.63 billion suggest some investment in growth and expansion, it is insufficient to offset the negative cash flow situation.
Overall, the combination of declining revenue, high debt levels, and negative cash flow presents a concerning picture for FE’s financial health, leading to a strong sell recommendation. Investors should exercise caution and thoroughly evaluate the company’s ability to navigate its challenges before considering any investment.
Financial Health
🔴 Net Income for the most recent period was $45 million, but the year-over-year net income trend shows a decrease, raising concerns about future profitability.
🔴 The Debt-to-Equity Ratio is extremely high at 4.32, indicating significant financial leverage and potential risk.
🔴 Current Ratio is low at 0.36, suggesting potential liquidity risk and challenges in meeting short-term obligations.
🔴 Cash to Total Assets Ratio is only 0.01, indicating limited financial flexibility and vulnerability to economic shocks.
Valuation
🔴 Forward P/E ratio of 15.09 suggests that the stock may be overvalued given the current financial performance.
🔴 Price-to-Sales Ratio of 1.93 indicates that the stock is trading at a relatively high valuation compared to its revenue.
Growth and Profitability
🔴 Revenue Growth (YoY) is negative at -0.21%, indicating a decline in revenue, which could negatively impact the stock price.
🔴 Earnings Growth is alarming at -80.90%, raising serious concerns about the company’s future profitability.
🔴 Net Profit Margin is low at 1.37%, which could be a concern for investors regarding the company’s ability to generate profits.
Shareholder Information
🔴 Average Ordinary Shares Outstanding is 574,590,297, which may indicate dilution concerns if the company issues more shares.
🔴 Average Treasury Shares are 0, suggesting no buybacks, which could indicate a lack of confidence in the stock’s future performance.
Income Statement
🔴 Total Revenue for the most recent period was $3.28 billion, but the negative revenue growth indicates potential challenges ahead.
🟢 Operating Margin is high at 97.44%, suggesting efficient operations, but this is overshadowed by other negative indicators.
🔴 Net Interest Income is negative at -$256 million, indicating that the company is paying more in interest on its debts than it is earning on its assets.
Balance Sheet
🔴 Average Net Debt is $24.09 billion, which warrants further investigation into its impact on financial flexibility.
🔴 The high Debt-to-Equity Ratio of 4.32 raises concerns about the company’s financial risk profile.
🔴 Current Ratio of 0.36 indicates potential liquidity issues, as the company might struggle to meet short-term financial obligations.
Cashflow
🔴 Free Cash Flow is negative at -$2.05 billion, raising concerns about the company’s ability to fund operations and invest in growth.
🟢 Average Capital Expenditures of $2.63 billion suggest that the company is investing in growth and expansion, but this is not enough to offset the negative cash flow situation.
Overall, the combination of declining revenue, high debt levels, and negative cash flow presents a concerning picture for the company’s financial health, leading to a strong sell recommendation.
FE News Analysis
FirstEnergy (FE) is showing a positive outlook with recent developments, including upgrades and ongoing projects, but investors should remain cautious due to external factors.
Summary of FirstEnergy news indicates a generally positive sentiment for investors. The company’s proactive measures in response to Hurricane Helene, along with upgrades from analysts and ongoing solar projects, suggest a strong operational focus. However, the unchanged dividend may raise questions about growth potential. Investors should weigh these factors carefully.
🟢 FirstEnergy Electric Crews Mobilize to Assist with Anticipated Power Restoration Efforts in North Carolina and Georgia Following Hurricane Helene. This demonstrates the company’s commitment to service and reliability during emergencies, which can enhance its reputation and customer trust.
🟢 Morgan Stanley Adjusts Price Target on FirstEnergy to $51 From $48, Maintains Overweight. This upgrade indicates confidence in the company’s growth potential and suggests that analysts see value in FE stock.
🟢 FirstEnergy Corp. Declares Unchanged Common Stock Dividend of $0.425 Per Share. While maintaining the dividend is a sign of stability, it may also indicate a lack of aggressive growth plans, which could concern some investors.
🟢 FirstEnergy Units Start Construction of Third Solar Facility in WV. This move towards renewable energy aligns with industry trends and could position FE favorably in the long term.
🟢 Mon Power and Potomac Edison Break Ground on Third Solar Site. Similar to the previous point, this reflects FE’s commitment to expanding its renewable energy footprint, which is increasingly important for investors.
🟢 Argus Upgrades FirstEnergy to Buy From Hold, Price Target is $50. This upgrade from a reputable source adds to the positive sentiment surrounding FE and suggests that analysts believe in its potential for growth.
FE Holders Analysis
The financial landscape for FE indicates a mixed outlook for the next month. While there are positive aspects regarding institutional ownership, the low insider ownership and recent insider transactions raise some concerns.
🟢 FE has a **high institutional ownership** at **91.04%**, which reflects strong interest from large investors. This could provide stability and support for the stock price, especially if these institutions remain committed.
🔴 However, the **insider ownership is very low at 0.12%**, suggesting a lack of confidence from company management. This could indicate that insiders do not believe strongly in the company’s future performance, which is a red flag for potential investors.
🟡 The **number of institutional holders is substantial at 992**, indicating a diversified ownership base. This can help mitigate volatility, but it also means that if a few large holders decide to sell, it could lead to significant price fluctuations.
🟡 Recent insider transactions show a **lack of purchases** and a few sales, which does not inspire confidence. The absence of insider buying could suggest that insiders are not optimistic about the stock’s near-term performance.
🔴 The overall sentiment from insider transactions is concerning, as there have been more sales than purchases, indicating a potential lack of confidence in the company’s short-term prospects.
FE Analyst Ratings
The analyst ratings for FE show a mixed sentiment, with a total of 1 strong buy, 5 buy, 11 hold, and 1 sell rating over the last month. The recent upgrade from Argus Research from hold to buy indicates a positive shift in sentiment. However, the presence of 11 hold ratings suggests that many analysts are cautious about the stock’s near-term performance.
🟡 In the past month, there have been 1 strong buy rating, 5 buy ratings, 11 hold ratings, 0 sell ratings, and 0 strong sell ratings. This indicates a generally cautious outlook among analysts, with a slight tilt towards buying.
🟢 Given the recent upgrade and the overall balance of ratings, it is likely that FE will see moderate performance in the next month, with potential for growth. However, the medium confidence level reflects the mixed opinions among analysts, suggesting that investors should monitor the stock closely.
FE Economic Analysis
Based on the US economic and market data:
🔴 The unemployment rate has increased to 4.3%, up from 4.1% in the previous month, indicating potential weakness in the labor market which could lead to reduced consumer spending.
🟡 Retail sales have shown a slight increase, but the growth is modest at 3.8% year-over-year, suggesting that consumer demand is stable but not robust.
🔴 The Non-Farm Payroll data indicates a slowdown in job creation, with only 158,445 jobs added in July, which is lower than the previous month. This could signal a cooling economy.
🟢 The GDP growth rate remains positive, but the recent figures show a slight decline in growth momentum, which could impact utility companies like FirstEnergy Corp. negatively.
🔴 The rising Treasury yields, currently at 4.25%, could lead to higher borrowing costs for utilities, affecting their profitability and investment capabilities.
Overall, the mixed signals from the economic indicators suggest that while there is some stability, the potential for economic slowdown and rising costs could weigh on FirstEnergy’s stock price in the coming month. The current price of $43.61 is near the 52-week high of $44.97, indicating limited upside potential in the short term.
Disclaimer
Investors may consider the AI predictions and news summaries as one factor in their investment decisions alongside their own research and risk tolerance.


