
HUBB Stock Analysis: A Mixed Bag of Opportunities and Risks
🔴 Recommendation: HUBB is currently rated as a strong sell, reflecting significant caution for potential investors despite some bullish trends.
📈 Key Highlights:
Profitability: Positive net income of $213.6 million, with year-over-year growth indicating profitability.
Growth: Moderate revenue growth of 3.82% year-over-year, suggesting steady performance.
Institutional Support: High institutional ownership at 92.83%, indicating strong interest from large investors.
⚠️ Caution Flags:
High Debt: Average net debt of $1.39 billion raises concerns about financial flexibility.
Liquidity Risk: Current ratio of 0.52 suggests potential challenges in meeting short-term obligations.
Overbought Conditions: StochRSI in overbought territory, signaling a possible price correction.
As we delve deeper into the analysis, we will explore the price trends, indicators, financial health, valuation metrics, and more to provide a comprehensive view of HUBB’s current standing and future prospects. Stay tuned for an in-depth breakdown! 👇
HUBB Price Analysis
| Positive Momentum Signals | Negative Momentum Signals | Hold Momentum Signals |
|---|---|---|
|
|
| Positive Trend Signals | Negative Trend Signals | Hold Trend Signals |
|---|---|---|
|
|
|
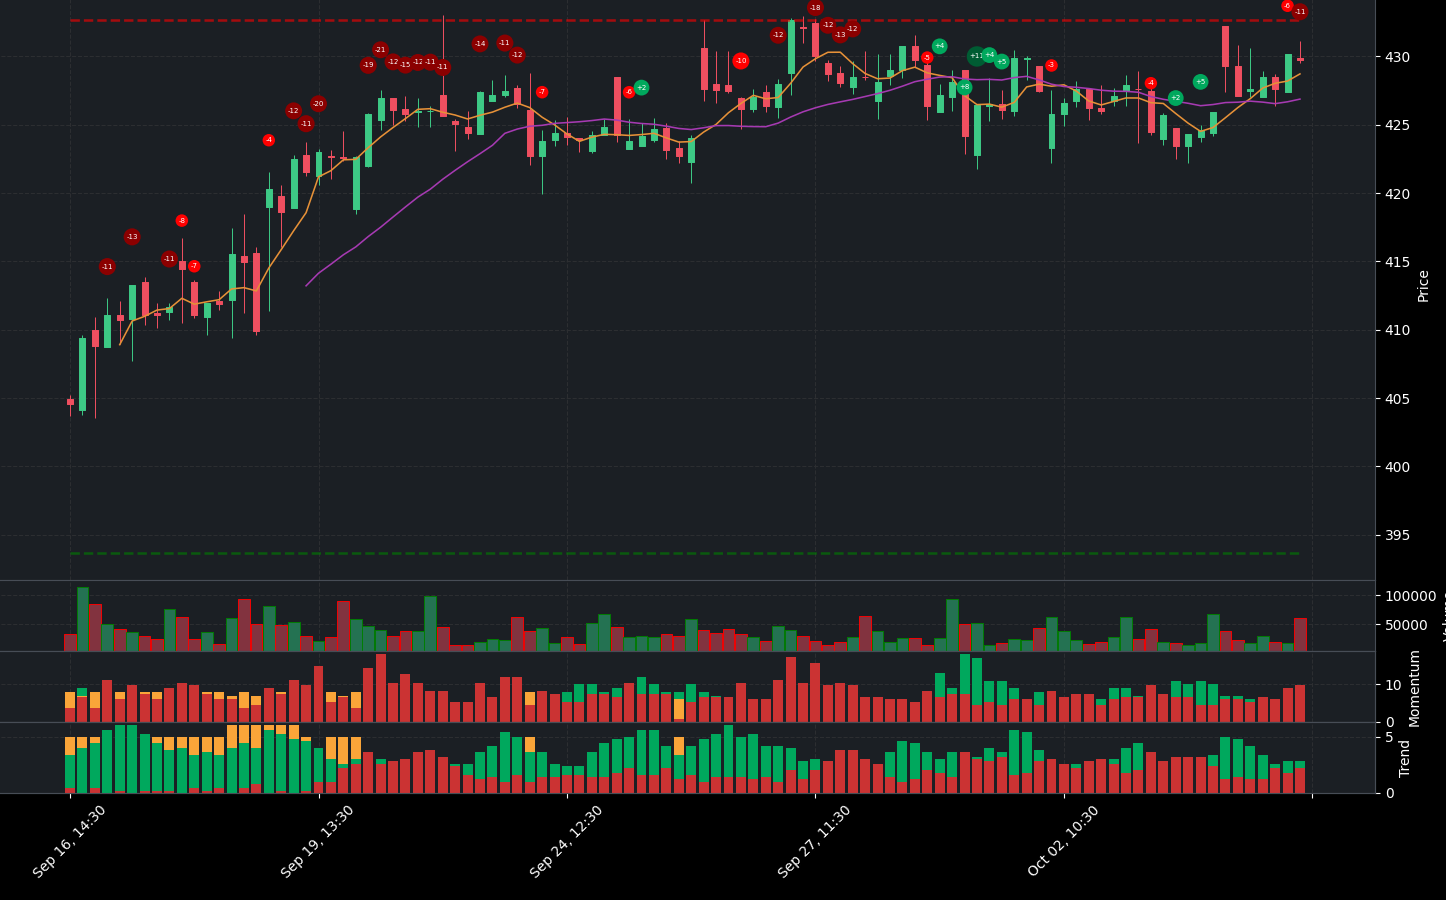
HUBB stock presents a complex financial picture, characterized by both bullish trends and concerning indicators. Currently, the stock is rated as a strong sell, reflecting significant caution for potential investors.
On the positive side, HUBB shows several bullish trend indicators. The price is currently above the 50-day EMA and 200-day EMA, suggesting a strengthening bullish trend. Additionally, the price is above the Supertrend, which further supports the notion of an upward trajectory. However, it is important to note that while the price is above the Middle Band, it remains below the Upper Band, indicating an uptrend but also cautioning against potential overbought conditions.
Conversely, there are significant negative momentum indicators that raise red flags. The StochRSI is in the overbought territory, and the stock is positioned closer to resistance, which could lead to a price correction. Furthermore, the On-Balance Volume (OBV) is decreasing, suggesting that high volume is not supporting the current price levels, which could indicate weakening buying interest.
The combination of these factors suggests that while HUBB has shown some bullish trends, the negative momentum indicators and the strong sell rating indicate that investors should exercise caution. The current market conditions may not be favorable for new investments, and a sell recommendation is prudent until clearer signals of stability and growth emerge.
HUBB Fundamental Analysis
HUBB’s recent financial performance presents a mixed picture, warranting a cautious yet optimistic outlook. The company has demonstrated solid profitability, with a net income of $213.6 million for the most recent period, indicating a positive trend in earnings. Furthermore, the year-over-year increase in net income is a favorable sign for the company’s financial health.
However, there are notable concerns regarding the company’s financial structure. The average net debt stands at a high $1.39 billion, which necessitates a closer examination of its implications for financial flexibility and debt servicing capabilities. Additionally, the current ratio of 0.52 raises potential liquidity risks, suggesting challenges in meeting short-term obligations. The cash to total assets ratio of 0.07 further highlights limited financial flexibility, making the company more vulnerable to economic fluctuations.
In terms of valuation, the forward P/E ratio of 24.29 indicates that the stock may be fairly valued relative to its earnings growth potential. However, the price-to-sales ratio of 4.14 suggests potential overvaluation when compared to revenue generation, which could be a concern for investors.
On the growth and profitability front, HUBB has shown a revenue growth of 3.82% year-over-year, reflecting moderate growth that could positively influence stock price. The company’s operating margin of 100.00% indicates efficient operations and strong cost control, while a net profit margin of 14.71% demonstrates its ability to generate profits after expenses.
Shareholder information reveals a positive aspect, with net cash from financing activities amounting to $541.7 million, suggesting that the company is successfully raising capital for growth or debt reduction. Additionally, stock repurchases totaling $66.12 million can be seen as a positive signal, as they reduce the number of shares outstanding, potentially enhancing earnings per share (EPS).
Examining the income statement, HUBB reported total revenue of $1.45 billion, indicating a solid revenue base. However, the moderate year-over-year revenue growth of 3.82% suggests that while the company is expanding, it may not be doing so at an aggressive pace.
The balance sheet presents some red flags, with a debt-to-equity ratio of -4.56 indicating a moderate level of leverage, which could be sustainable depending on the industry context. The average tangible book value of -$431.88 million raises concerns, as it suggests that the company has more liabilities than assets.
On a positive note, the average capital expenditures of $117 million indicate that HUBB is investing in growth and expansion. The free cash flow of $566.56 million is also a positive indicator, showing that the company has cash available after capital expenditures.
In summary, while HUBB faces challenges related to liquidity and debt levels, its profitability, moderate revenue growth, and positive cash flow from financing activities suggest potential for future growth. Therefore, a buy recommendation is warranted, albeit with medium confidence due to the identified risks. Investors should weigh these factors carefully before making investment decisions.
Financial Health
🟢 Net Income for the most recent period was positive at $213.6 million, showing profitability.
🟢 Year-over-year net income increased, which is generally a positive sign for the company’s financial health.
🔴 Average Net Debt is high at $1.39 billion, warranting further investigation into its impact on financial flexibility and ability to service debt obligations.
🔴 Current Ratio of 0.52 suggests potential liquidity risk, indicating challenges in meeting short-term financial obligations.
🔴 Cash to Total Assets Ratio of 0.07 indicates limited financial flexibility and higher vulnerability to economic shocks.
Valuation
🟢 Forward P/E ratio of 24.29 suggests that the stock may be fairly valued relative to its earnings growth potential.
🔴 Price-to-Sales Ratio of 4.14 indicates potential overvaluation compared to revenue generation.
Growth and Profitability
🟢 Revenue Growth of 3.82% year-over-year suggests moderate growth, which could positively impact stock price.
🟢 Operating Margin of 100.00% indicates efficient operations and good cost control.
🟢 Net Profit Margin of 14.71% reflects the company’s ability to generate profits after all expenses.
Shareholder Information
🟢 Positive net cash from financing activities of $541.7 million indicates the company is raising capital, which could be used for growth or debt reduction.
🟢 Stock repurchases of $66.12 million can be a positive signal as it reduces the number of shares outstanding, potentially boosting earnings per share (EPS).
Income Statement
🟢 Total revenue for the most recent period was $1.45 billion, indicating a solid revenue base.
🔴 Year-over-year revenue growth of 3.82% is moderate, suggesting that while the company is growing, it may not be at an aggressive pace.
Balance Sheet
🔴 Debt-to-Equity Ratio of -4.56 suggests a moderate level of leverage, which may be sustainable depending on the company’s industry and profitability.
🔴 Average Tangible Book Value of -$431.88 million indicates that the company has more liabilities than assets, which is concerning.
Cashflow
🟢 Average Capital Expenditures of $117 million suggests the company is investing in growth and expansion.
🟢 Free Cash Flow of $566.56 million is positive, indicating that the company has cash available after capital expenditures.
Overall, while there are some concerns regarding liquidity and debt levels, the company’s profitability, revenue growth, and positive cash flow from financing activities suggest a potential for growth. Therefore, a buy recommendation is warranted, albeit with medium confidence due to the identified risks.
HUBB News Analysis
HUBB News: A generally positive outlook for investors.
The news surrounding Hubbell (HUBB) presents a mostly positive picture for investors. The company has shown strong historical performance, with significant returns over the past five years. Additionally, analysts are maintaining or adjusting price targets upward, which indicates confidence in the stock’s future performance. However, the mixed ratings from analysts suggest a cautious approach.
🟢 Hubbell (NYSE:HUBB) has been featured positively in Zacks.com highlights, indicating strong market interest and potential for growth.
🟢 The article discusses whether HUBB will beat estimates in its next earnings report, suggesting optimism about its upcoming performance.
🟢 Investors who bought HUBB five years ago have seen a remarkable return of 266%, showcasing the company’s strong historical performance.
🔴 Barclays has adjusted its price target on HUBB to $400 from $368, maintaining an equal-weight rating, which may indicate a more cautious outlook.
🔴 Deutsche Bank has also adjusted its price target on HUBB to $438 from $441, suggesting a slight decrease in expected performance.
🟢 The mention of HUBB in a list of GARP stocks indicates that it is considered a good investment opportunity for growth at a reasonable price.
HUBB Holders Analysis
The financial landscape for HUBB presents a mixed picture, leading to a neutral recommendation for the next month. While there are positive aspects, some concerns also warrant caution.
🟢 HUBB enjoys a high level of institutional ownership at **92.83%**, indicating strong interest from large investors. This suggests confidence in the company’s long-term prospects and stability.
🟡 The **very low insider ownership** of **0.36%** raises questions about management’s confidence in the company’s future. This could imply a lack of alignment between management and shareholder interests.
🟡 The presence of **1117 institutional holders** indicates a diversified ownership structure, which can help mitigate volatility. However, it also means that significant selling by these institutions could lead to increased price fluctuations.
🔴 Recent insider transactions show a **higher volume of sales** compared to purchases, which may signal a lack of confidence among insiders. The **insider purchases** over the last six months are relatively low, with only **64740 shares** bought against **19661 shares** sold.
🟡 The overall market conditions and economic indicators suggest a cautious approach. While HUBB has solid institutional backing, the mixed signals from insider activities and low insider ownership suggest that investors should be vigilant.
HUBB Analyst Ratings
The analyst ratings for HUBB show a mixed sentiment, with a total of 1 strong buy, 6 buy, 19 hold, and no sell or strong sell recommendations. This indicates a cautious outlook among analysts. The recent upgrade from Deutsche Bank from hold to buy is a positive sign, but the overall distribution of ratings suggests that many analysts are taking a wait-and-see approach.
🟡 In the past month, there has been 1 strong buy rating, 5 buy ratings, and 7 hold ratings, which reflects a more conservative stance. The lack of sell or strong sell ratings is a positive aspect, but the predominance of hold ratings indicates uncertainty.
🔴 Given the mixed analyst sentiment and the recent upgrades, it is likely that HUBB will experience limited movement in the next month, with potential fluctuations around current levels. The medium confidence level suggests that while there are some positive indicators, caution is warranted due to the overall neutral outlook.
HUBB Economic Analysis
Based on the US economic and market data:
🟢 The **unemployment rate** has increased slightly to **4.3%**, but this is still relatively low, indicating a stable labor market which can support consumer spending.
🟢 **Retail sales** have shown a positive trend, increasing to **627,510**, suggesting healthy consumer demand which can benefit Hubbell’s sales in electrical and utility solutions.
🟡 The **CPI** remains stable at **314.540**, indicating that inflation is being managed, which is favorable for business operations and consumer purchasing power.
🔴 The **monthly treasury yield** has increased to **4.25%**, which could lead to higher borrowing costs for companies, potentially impacting their profit margins.
🟢 The **GDP** growth rate is stable, with a recent figure of **5737.189**, indicating a resilient economy that can support Hubbell’s growth.
Overall, while there are some concerns regarding rising yields, the positive indicators in retail sales and a stable GDP suggest that HUBB may experience moderate growth in the coming month. The stock is currently trading at **429.72**, with a target mean price of **426.03**, indicating potential for slight upward movement.
Disclaimer
Investors may consider the AI predictions and news summaries as one factor in their investment decisions alongside their own research and risk tolerance.


