LPLA Stock Analysis: A Cautious Outlook Amid Mixed Signals
🔴 Recommendation: LPLA is currently presenting a complex financial picture, characterized by several bearish indicators that warrant caution among investors.
📈 Key Highlights:
Price Action: LPLA is trading below both the 50-day and 200-day EMA, indicating a strengthening bearish trend.
Momentum Indicators: The StochRSI suggests the stock is in an oversold condition, hinting at potential for a short-term rebound.
Financial Health: While the current ratio of 1.37 indicates healthy liquidity, concerns arise from a high net debt of $2.74 billion and a declining net income trend.
⚠️ Caution Flags:
Profitability Challenges: Earnings growth is negative at -11.50%, and the net profit margin of 8.32% is relatively low.
High Institutional Ownership: At 97.39%, this could lead to increased volatility if large investors decide to sell.
As we delve deeper into the details, we will break down the price trends, indicators, financial health, valuation metrics, and more to provide a comprehensive analysis of LPLA’s current standing and future potential. 👇
LPLA Price Analysis
| Positive Momentum Signals | Negative Momentum Signals | Hold Momentum Signals |
|---|---|---|
|
|
| Positive Trend Signals | Negative Trend Signals | Hold Trend Signals |
|---|---|---|
|
|
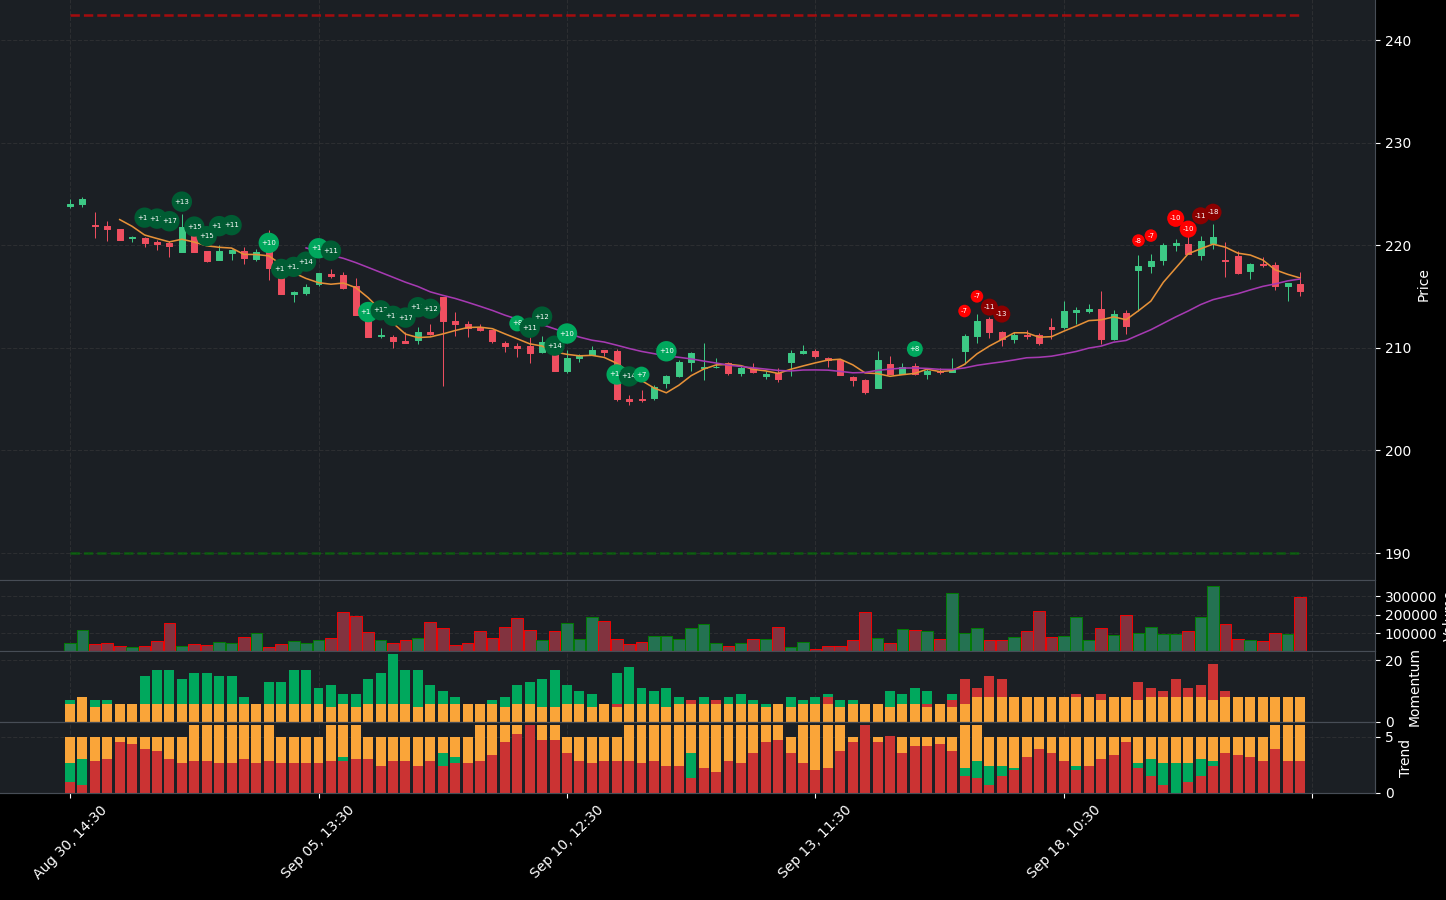
LPLA stock presents a complex financial picture, characterized by several bearish indicators that warrant caution among investors. Currently, the stock is trading at a neutral price level, but the momentum indicators suggest a potential for recovery, as the StochRSI indicates that the stock is in an oversold condition.
However, the overall trend remains concerning. The price is below the 50-day EMA and the 200-day EMA, both of which are indicative of a bearish trend that is strengthening. Additionally, the Supertrend indicator confirms this bearish sentiment, as the price is below the Supertrend line. The On-Balance Volume (OBV) is also decreasing, suggesting that selling pressure is outweighing buying interest, which is further compounded by high volume decreasing.
The price action indicates that LPLA is currently in a downtrend, although it is important to note the oversold conditions that could lead to a short-term rebound. The price is situated between the Middle Band and Lower Band, reinforcing the caution needed in this downtrend scenario.
Given these factors, investors should approach LPLA with a cautious outlook. While the oversold conditions may present a buying opportunity for some, the prevailing bearish trends and decreasing volume suggest that a hold or sell recommendation may be more prudent until clearer signs of recovery emerge.
LPLA Fundamental Analysis
LPLA’s recent financial performance presents a mixed picture, prompting a cautious outlook for potential investors. The company reported a net income of $243.8 million for the most recent period; however, the year-over-year trend shows a concerning decrease, raising questions about its future profitability. Additionally, the average net debt stands at a high $2.74 billion, which necessitates further scrutiny regarding its impact on financial flexibility and the company’s ability to meet its debt obligations.
On a positive note, LPLA maintains a current ratio of 1.37, indicating a healthy liquidity position that suggests the company can comfortably cover its short-term liabilities. However, the cash to total assets ratio of 0.09 is low, highlighting limited financial flexibility and increased vulnerability to economic downturns.
In terms of valuation, the forward P/E ratio of 11.03 indicates potential future undervaluation, which could be appealing for investors. Conversely, the price-to-sales ratio of 1.47 suggests that the stock may be fairly valued but not necessarily undervalued.
When examining growth and profitability, LPLA shows a revenue growth of 3.50% year-over-year, which is a positive sign. However, the negative earnings growth of -11.50% raises concerns about the company’s ability to maintain profitability. Furthermore, the net profit margin of 8.32% is relatively low, which could deter potential investors.
Shareholder information reveals some encouraging signs, such as positive net cash from financing activities, indicating that the company is raising capital for growth or debt reduction. Additionally, stock repurchases totaling $416.3 million reflect management’s confidence in the company’s future prospects.
From an income statement perspective, LPLA reported total revenue of $2.93 billion, showcasing a solid revenue base. However, the operating margin of 99.52% suggests efficient operations, yet the low net profit margin raises concerns about overall profitability.
On the balance sheet, the debt-to-equity ratio of -13.61 indicates a moderate level of leverage, which may be sustainable depending on the company’s industry and profitability. Alarmingly, the average tangible book value is negative at -$283.6 million, signaling that liabilities exceed assets, which is a significant red flag for investors.
In terms of cash flow, LPLA demonstrates positive signs with average capital expenditures of $270.4 million, indicating investment in growth and expansion. The positive free cash flow of $460.20 million suggests that the company has cash available for investments, debt reduction, or dividends.
Overall, while LPLA exhibits some positive indicators such as revenue growth and liquidity, the concerns surrounding net income trends, profitability margins, and high debt levels suggest a cautious approach. Investors should carefully consider these factors before making any investment decisions regarding LPLA stock.
Financial Health
🔴 Net Income for the most recent period was $243.8 million, but the year-over-year net income trend shows a decrease, raising concerns about future profitability.
🔴 Average Net Debt is high at $2.74 billion, which warrants further investigation into its impact on financial flexibility and ability to service debt obligations.
🟢 Current Ratio of 1.37 indicates a healthy liquidity position, suggesting the company can cover its short-term liabilities comfortably.
🔴 Cash to Total Assets Ratio is low at 0.09, indicating limited financial flexibility and vulnerability to economic shocks.
Valuation
🟢 Forward P/E ratio of 11.03 suggests potential future undervaluation, which could be attractive for investors.
🔴 Price-to-Sales Ratio of 1.47 indicates that the stock may be fairly valued but not necessarily undervalued.
Growth and Profitability
🟢 Revenue Growth of 3.50% year-over-year suggests moderate growth, which could still be positive for the stock price.
🔴 Earnings Growth is negative at -11.50%, indicating challenges in maintaining profitability.
🔴 Net Profit Margin of 8.32% is relatively low, which could be a concern for investors.
Shareholder Information
🟢 Positive net cash from financing activities indicates the company is raising capital, which could be used for growth or debt reduction.
🟢 Stock repurchases of $416.3 million can signal management’s confidence in the company’s future prospects.
Income Statement
🟢 Total Revenue for the most recent period was $2.93 billion, showing a solid revenue base.
🔴 Operating Margin of 99.52% suggests efficient operations, but the low net profit margin raises concerns about overall profitability.
Balance Sheet
🔴 Debt-to-Equity Ratio of -13.61 suggests a moderate level of leverage, which may be sustainable depending on the company’s industry and profitability.
🔴 Average Tangible Book Value is negative at -$283.6 million, indicating that liabilities exceed assets, which is a red flag for investors.
Cashflow
🟢 Average Capital Expenditures of $270.4 million suggest the company is investing in growth and expansion.
🟢 Positive free cash flow of $460.20 million indicates that the company has cash available for investments, debt reduction, or dividends.
Overall, while there are some positive indicators such as revenue growth and liquidity, the concerns regarding net income trends, profitability margins, and high debt levels suggest a cautious approach.
LPLA News Analysis
LPLA News: A strong outlook for investors.
The recent news surrounding LPL Financial (LPLA) presents a largely positive picture for investors. The increase in brokerage and advisory assets, along with strategic expansions and acquisitions, indicates strong growth potential. Investors should consider these developments as favorable signs for the company’s future performance.
🟢 LPLA’s August Brokerage and Advisory Assets Up on Upbeat Markets highlights a positive trend in asset growth, suggesting that the company is benefiting from favorable market conditions.
🟢 LPL Financial Advisory, Brokerage Assets Rose 2% in August further confirms the upward trajectory in assets, indicating robust client engagement and market confidence.
🟢 LPL Financial Reports Monthly Activity for August 2024 provides transparency and showcases the company’s operational strength, which is essential for investor confidence.
🔴 Some Financial Giants Pay Paltry Rates on Investors’ Cash raises concerns about competitive positioning, but LPLA’s growth in assets may mitigate this risk.
🟢 LPL Financial welcomes Bury Financial Group, which signifies strategic growth through partnerships, enhancing its service offerings and market reach.
🟢 Buyouts, Solid Advisor Productivity Aid LPL Financial Amid Cost Woes suggests that the company is effectively managing costs while expanding its advisor network, which is a positive indicator of operational efficiency.
🟢 LPL Financial Expands to Tempe indicates geographic expansion, which can lead to increased market share and revenue growth.
🟢 LPL Financial Welcomes The Bindra Group to Linsco Channel reflects ongoing efforts to strengthen its advisor network, which is crucial for long-term growth.
LPLA Holders Analysis
The financial landscape for LPLA indicates a generally positive outlook, but caution is warranted due to mixed signals from insider activities and the high level of institutional ownership.
🟢 LPLA has a **high institutional ownership** at 97.39%, which reflects strong interest from large investors. This suggests confidence in the company’s future performance and stability.
🟡 The **insider ownership** is very low at 0.69%, indicating a potential lack of confidence from management or a high degree of external control. This could be a red flag for some investors.
🟡 Recent **insider transactions** show a mix of purchases and sales, with a notable number of shares sold. While this could indicate a lack of confidence, it is essential to consider that these transactions may be part of pre-planned strategies rather than a direct reflection of the company’s health.
🟢 The **number of institutional holders** is substantial at 926, suggesting a diversified ownership structure that can help stabilize the stock price against volatility.
🔴 The **high institutional ownership** could lead to increased volatility if large investors decide to sell, which is a risk factor to consider.
LPLA Analyst Ratings
The analyst ratings for LPLA show a mixed sentiment, with a notable number of buy and hold recommendations. Over the past month, there have been 5 strong buy ratings, 6 buy ratings, 4 hold ratings, 1 sell rating, and no strong sell ratings. This indicates a generally positive outlook among analysts, although the presence of hold and sell ratings suggests some caution. 🟡
In the last three months, the trend has been relatively stable, with a consistent number of buy and hold ratings. The recent upgrades from firms like B of A Securities indicate a growing confidence in the stock’s potential. 🟢
Given the current analyst sentiment and the lack of strong sell recommendations, it is likely that LPLA will perform moderately well in the next month. However, the medium confidence level suggests that investors should remain vigilant and consider market conditions. A target price increase of around 5-10% could be expected based on the current ratings and market trends.
LPLA Economic Analysis
Based on the US economic and market data:
🔴 The unemployment rate has increased to 4.3%, up from 4.1% in the previous month, indicating potential weakness in the labor market. This could lead to reduced consumer spending, negatively impacting LPL Financial’s revenue growth.
🟡 Retail sales have shown a slight increase, but the overall growth rate is modest. This suggests that while consumers are still spending, the pace is not robust enough to drive significant economic momentum.
🔴 The recent CPI data indicates persistent inflation, which could lead to further interest rate hikes by the Federal Reserve. Higher interest rates generally have a negative impact on financial services firms like LPL Financial, as they can reduce borrowing and investment activity.
🟢 On a positive note, LPL Financial’s revenue growth of 18.8% year-over-year is encouraging, and the company’s diversified service offerings may help mitigate some of the economic headwinds.
🔴 The trailing PE ratio of 16.79 suggests that the stock may be overvalued compared to its earnings growth, especially in a potentially slowing economic environment.
Overall, while LPL Financial has strong fundamentals, the current economic indicators suggest a cautious outlook for the next month. The stock may face downward pressure due to rising unemployment and inflation concerns, but its solid revenue growth could provide some support.
Disclaimer
Investors may consider the AI predictions and news summaries as one factor in their investment decisions alongside their own research and risk tolerance.

