
META Stock Analysis: A Cautious Outlook Amidst Mixed Signals
🔴 Recommendation: META is currently rated as a sell, reflecting a complex financial picture with both positive and negative indicators that warrant caution.
📈 Key Highlights:
Financial Health: Strong net income of $13.47 billion and an impressive operating margin of 99.00% demonstrate exceptional profitability and operational efficiency.
Growth Potential: Earnings growth of 73.20% and revenue growth of 22.10% indicate robust business performance and increasing demand for META’s products and services.
Institutional Support: High institutional ownership at 79.16% suggests significant confidence from large investors, although low insider ownership raises concerns about management confidence.
⚠️ Caution Flags:
Bearish Indicators: The Supertrend indicator is currently bearish, and the stock is trading closer to resistance, which could limit upside potential.
Valuation Concerns: A price-to-sales ratio of 9.98 indicates that the stock may be slightly overvalued, despite strong revenue growth.
As we delve deeper into the analysis, we will explore the price trends, technical indicators, financial health, valuation metrics, and the latest news surrounding META to provide a comprehensive overview of its current standing and future prospects. Let’s dive into the details as we break down the various aspects of META’s stock performance 👇
META Price Analysis
| Positive Momentum Signals | Negative Momentum Signals | Hold Momentum Signals |
|---|---|---|
|
|
|
| Positive Trend Signals | Negative Trend Signals | Hold Trend Signals |
|---|---|---|
|
|
|
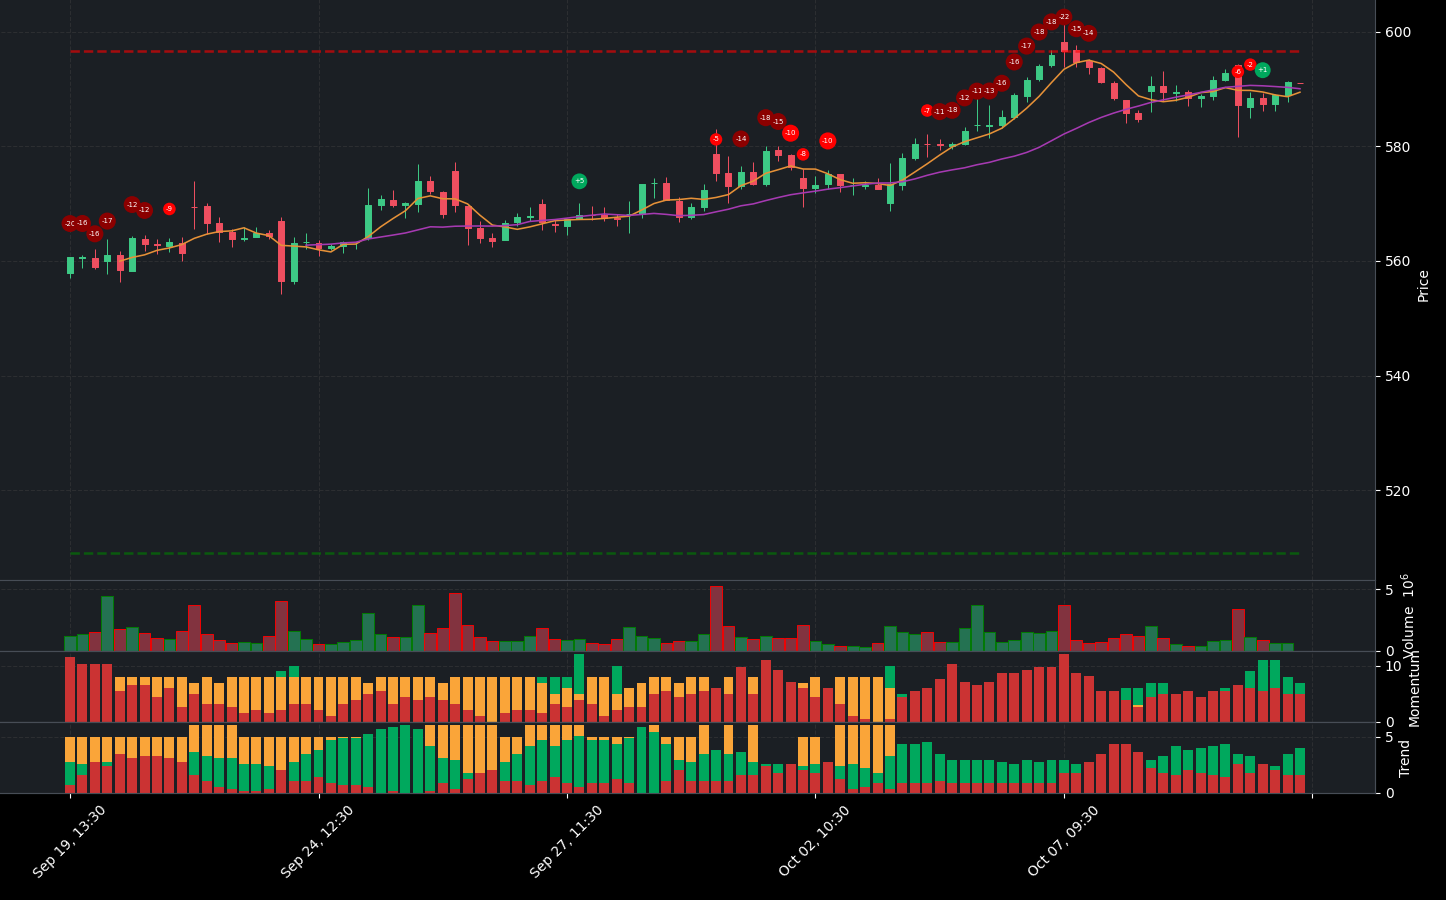
META stock presents a complex financial picture, characterized by both positive and negative indicators. Currently, the stock is rated as a sell, reflecting caution in the face of mixed momentum and trend signals.
On the positive side, META shows signs of potential recovery with the WaveTrend indicator indicating oversold conditions, suggesting a possible bottom. Additionally, the stock is trading above the 50-day and 200-day EMA, which indicates a bullish trend that is strengthening. The price is also above the middle band of its Bollinger Bands, although it remains below the upper band, indicating an uptrend but caution is warranted due to potential overbought conditions. Furthermore, the MACD has shown a positive histogram crossover, which is another bullish signal.
However, there are significant negative indicators that investors should consider. The Supertrend indicator is currently bearish, with the price trading below it, suggesting a prevailing downtrend. Additionally, the stock’s position is closer to resistance, which could limit upside potential and increase the risk of a pullback.
In summary, while META exhibits some positive momentum and trend indicators, the bearish signals from the Supertrend and the proximity to resistance suggest that investors should exercise caution. Given the current market conditions and the mixed signals, a hold or sell recommendation is advisable until clearer bullish trends emerge.
META Fundamental Analysis
META’s recent financial performance presents a compelling case for investment, characterized by strong profitability and robust growth metrics. The company reported a net income of $13.47 billion for the most recent period, showcasing its strong profitability. Notably, year-over-year net income has increased, indicating positive momentum for future performance. The operating margin is exceptionally high at 99.00%, reflecting outstanding operational efficiency and effective cost control. Furthermore, a net profit margin of 34.46% underscores META’s strong capability to generate profits after accounting for all expenses.
In terms of liquidity, META maintains a healthy current ratio of 2.47, suggesting that the company can comfortably meet its short-term liabilities. However, the cash to total assets ratio is relatively low at 0.16, which may limit financial flexibility during economic downturns.
From a valuation perspective, the forward P/E ratio of 24.41 indicates a reasonable valuation in light of the company’s impressive earnings growth of 73.20%. The price-to-sales ratio of 9.98 suggests that the stock may be slightly overvalued, but this is mitigated by strong revenue growth of 22.10%.
META’s growth and profitability metrics are particularly noteworthy, with earnings growth of 73.20% signaling robust business performance. Revenue growth of 22.10% reflects increasing demand for the company’s products and services, while profit margins of 34.34% and operating margins of 38.10% demonstrate effective profit generation.
Shareholder information reveals a positive net cash from financing of $5.39 billion, indicating effective capital raising strategies that could be directed towards growth initiatives or debt reduction. Additionally, stock repurchases totaling $24.63 billion reflect management’s confidence in the company’s future and serve to enhance shareholder value by reducing the number of shares outstanding.
On the income statement, META reported total revenue of $39.07 billion, with a year-over-year revenue growth of 7.18%, suggesting moderate yet positive growth prospects. The balance sheet shows a manageable debt-to-equity ratio of 0.29, indicating a moderate level of leverage that is sustainable given the company’s profitability. The average tangible book value of $126.12 billion signifies a solid net worth after liabilities, contributing to financial stability. However, the average total debt of $37.06 billion warrants further analysis to understand its composition and terms.
In terms of cash flow, META’s average capital expenditures of $23.14 billion indicate a commitment to growth and expansion, which is a positive sign for future performance. The company also boasts a positive free cash flow of $32.01 billion, providing ample cash for investments, debt reduction, or dividends.
Overall, the financial indicators suggest that META is in a strong position with robust profitability, healthy growth, and effective management of resources, making it a strong buy for investors looking for a solid investment opportunity.
Financial Health
🟢 Net Income for the most recent period was $13.47 billion, indicating strong profitability.
🟢 Year-over-year net income increased, which is a positive sign for future performance.
🟢 Operating margin stands at 99.00%, reflecting exceptional operational efficiency and cost control.
🟢 Net profit margin of 34.46% demonstrates the company’s strong ability to generate profits after all expenses.
🟢 Current ratio of 2.47 indicates a healthy liquidity position, suggesting the company can comfortably cover its short-term liabilities.
🔴 Cash to total assets ratio is relatively low at 0.16, which may indicate limited financial flexibility in times of economic stress.
Valuation
🟢 Forward P/E ratio of 24.41 suggests reasonable valuation given the strong earnings growth of 73.20%.
🟢 Price-to-sales ratio of 9.98 indicates that the stock may be slightly overvalued, but this is mitigated by strong revenue growth of 22.10%.
Growth and Profitability
🟢 Earnings growth of 73.20% is exceptionally strong, indicating robust business performance.
🟢 Revenue growth of 22.10% suggests increasing demand for the company’s products and services.
🟢 Profit margins of 34.34% and operating margins of 38.10% demonstrate the company’s ability to generate profits efficiently.
Shareholder Information
🟢 Positive net cash from financing of $5.39 billion indicates that the company is raising capital effectively, which could be used for growth or debt reduction.
🟢 Stock repurchases of $24.63 billion signal confidence in the company’s future and can enhance shareholder value by reducing the number of shares outstanding.
Income Statement
🟢 Total revenue for the most recent period was $39.07 billion, reflecting strong sales performance.
🟢 Year-over-year revenue growth of 7.18% suggests moderate growth, which is still positive for the stock price.
Balance Sheet
🟢 Debt-to-equity ratio of 0.29 indicates a moderate level of leverage, which is manageable given the company’s profitability.
🟢 Average tangible book value of $126.12 billion represents a solid net worth after liabilities, indicating financial stability.
🔴 Average total debt of $37.06 billion requires further analysis to understand its composition and terms.
Cashflow
🟢 Average capital expenditures of $23.14 billion suggest that the company is investing in growth and expansion, which is a positive indicator for future performance.
🟢 Positive free cash flow of $32.01 billion indicates that the company has cash available for investments, debt reduction, or dividends.
Overall, the financial indicators suggest that META is in a strong position with robust profitability, healthy growth, and effective management of resources, making it a strong buy.
META News Analysis
META News: A strong outlook for investors.
Summary of META news indicates a robust growth trajectory for Meta Platforms (META) as it expands its AI capabilities and launches new products. The recent developments in AI technology and market expansion are likely to enhance META’s competitive edge and revenue potential. Investors should view these advancements positively, as they suggest a strong future performance for the stock.
🟢 Meta has been recognized as an AI behemoth, showcasing its significant advancements in artificial intelligence technology.
🟢 The launch of an AI chatbot in six countries, including Brazil and the UK, demonstrates META’s commitment to expanding its AI offerings and tapping into new markets.
🟢 This expansion is likely to drive user engagement and revenue growth, positioning META favorably against competitors like Amazon, Google, and Microsoft.
🟢 Analysts are pointing to significant upside potential for META amid the growing impact of generative AI, indicating strong investor confidence.
🟢 The positive sentiment surrounding META’s growth as a strong growth stock further reinforces the bullish outlook.
META Holders Analysis
The financial landscape for META indicates a cautious yet optimistic outlook for the next month. The high institutional ownership suggests strong backing, but the low insider ownership raises some concerns about management confidence.
🟢 META has a **high institutional ownership** at **79.16%**, indicating significant interest from large investors, which typically reflects confidence in the company’s future performance. Major holders like Vanguard and Blackrock have substantial stakes, suggesting they believe in META’s growth potential.
🔴 However, the **insider ownership is very low at 0.16%**, which may indicate a lack of confidence from company management or a high degree of external control. This could lead to volatility if institutional investors decide to sell.
🟡 The **number of institutional holders is quite large at 5194**, which indicates a diversified ownership structure. This can help stabilize the stock price, but it also means that any significant sell-off by these institutions could lead to increased volatility.
🟡 Recent insider transactions show a mix of sales and minimal purchases, which does not provide a strong bullish signal. The lack of insider buying could be interpreted as a lack of confidence in the near-term prospects.
🟢 Despite the mixed signals, META has shown resilience in its business model and continues to innovate, which could support its stock price in the coming month.
META Analyst Ratings
The analyst ratings for META have shown a strong positive trend, particularly over the last two months, with a significant number of analysts recommending a buy. In the last month alone, there were 20 strong buy ratings and 36 buy ratings, indicating a robust bullish sentiment among analysts. The consistent upgrades from firms like Cantor Fitzgerald and JP Morgan, which maintain their overweight ratings, further bolster this positive outlook.
🟢 The overall sentiment is supported by META’s strong performance in the digital advertising space and its ongoing investments in AI and the metaverse, which are expected to drive future growth.
META Economic Analysis
Based on the US economic and market data:
🟢 The **unemployment rate** has increased slightly to **4.3%**, but this is still relatively low, indicating a stable labor market that supports consumer spending. This is beneficial for Meta as it relies on advertising revenue, which is closely tied to consumer behavior.
🟢 **Retail sales** have shown a significant increase to **627,510**, suggesting strong consumer demand. This is a positive indicator for Meta’s advertising business, as higher retail sales often correlate with increased advertising budgets from businesses looking to capitalize on consumer spending.
🟢 The **GDP growth** has remained robust at **5737.189**, indicating a healthy economy. A growing economy typically leads to increased corporate earnings, which can positively impact Meta’s stock price.
🔴 The **CPI** remains high at **314.540**, indicating persistent inflation. While this could lead to potential interest rate hikes by the Federal Reserve, which may negatively impact growth stocks, Meta’s strong fundamentals and diversified revenue streams may help it weather these challenges.
🟢 The **trailing PE ratio** of **30.22** and **forward PE ratio** of **24.41** suggest that Meta is still reasonably valued compared to its growth potential, especially with an earnings growth rate of **73.2%**. This indicates that investors may still find value in Meta’s stock.
Overall, the combination of a stable labor market, strong retail sales, and robust GDP growth supports a positive outlook for Meta’s stock price over the next month. The potential risks from inflation and interest rates are present but manageable given the company’s strong fundamentals.
Disclaimer
Investors may consider the AI predictions and news summaries as one factor in their investment decisions alongside their own research and risk tolerance.


