META Stock Analysis: A Mixed Outlook for Investors
🔴 Recommendation: META stock presents a complex picture, with a neutral position reflecting a balance of both positive and negative momentum indicators.
📈 Key Highlights:
– **Financial Health**: Strong net income of $13.47 billion and an impressive operating margin of 99.00%.
– **Valuation**: Forward P/E ratio of 21.90 suggests reasonable valuation relative to expected earnings growth.
– **Growth Potential**: Earnings growth of 73.20% indicates strong future earnings potential.
⚠️ Caution Flags:
– **Bearish Trends**: The stock is closer to resistance and below the 50-day EMA, indicating a bearish trend.
– **Insider Selling**: Low insider ownership at 0.17% and consistent selling by CEO Mark Zuckerberg raise concerns.
– **Regulatory Scrutiny**: Allegations against META could impact its reputation and stock performance.
Let’s dive into the details as we break down the price trends, indicators, financial health, valuation metrics, and more 👇
META Price Analysis
| Positive Momentum Signals | Negative Momentum Signals | Hold Momentum Signals |
|---|---|---|
|
|
|
| Positive Trend Signals | Negative Trend Signals | Hold Trend Signals |
|---|---|---|
|
|
|
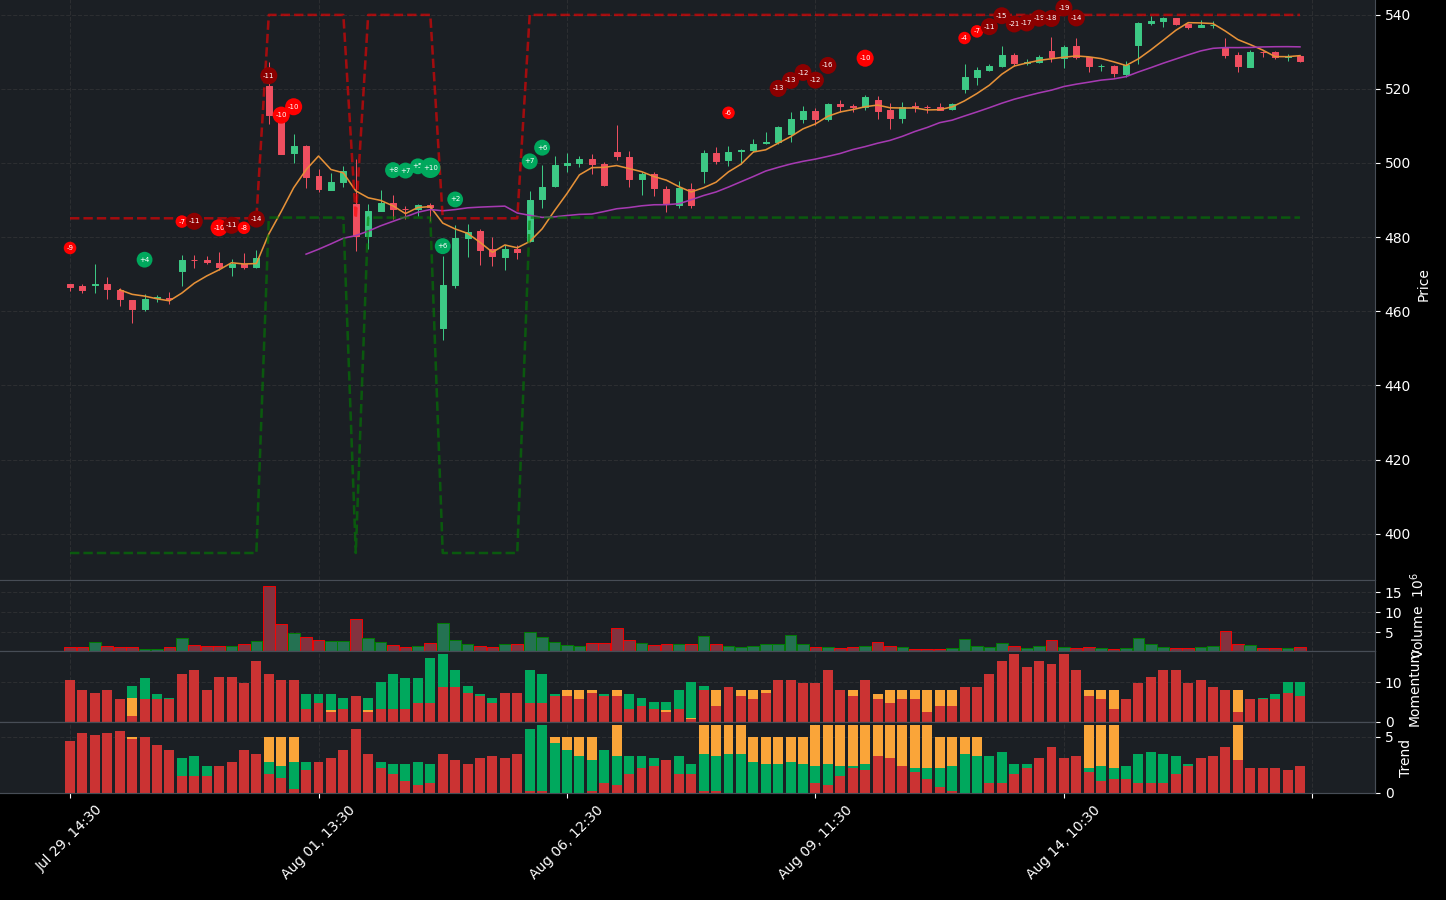
META stock presents a complex picture for investors. Currently, the stock is in a neutral position, reflecting a balance of both positive and negative momentum indicators. On the positive side, the StochRSI and WaveTrend indicators suggest that the stock is oversold, indicating a potential bottom and possible buying opportunity. Additionally, the price is above the 200-day EMA, which is a sign of a bullish trend that appears to be strengthening.
However, caution is warranted due to several negative momentum indicators. The stock is closer to resistance, and while it is above the lower band of its trading range, it remains below the middle band, indicating a downtrend. The OBV (On-Balance Volume) is decreasing, and the price is also below the 50-day EMA, which suggests a bearish trend that is strengthening. Furthermore, the Supertrend indicator confirms a bearish outlook, as the price is below the Supertrend line.
Recent trading data shows that META’s price has fluctuated slightly, with a closing price of 528.50 as of the latest session. The stock has experienced a 7-day price change of approximately -0.26% and a 14-day price change of about -1.67%, indicating some volatility. The RSI is currently at 49.35, suggesting that the stock is neither overbought nor oversold, but rather in a neutral zone.
Support levels are crucial for investors to monitor, with the closest support identified at 485.27. This level could serve as a critical point for potential price rebounds or further declines. The overall sentiment is mixed, with a final tally of 10 positive and 8 negative indicators, leading to a neutral position.
Given these factors, investors should approach META stock with caution. While there are signs of potential recovery due to oversold conditions, the prevailing bearish trends and proximity to resistance levels suggest that a hold or cautious buy strategy may be prudent until clearer signals of a trend reversal emerge.
META Fundamental Analysis
META’s recent financial performance presents a compelling case for investment, characterized by strong profitability and operational efficiency. The company reported a remarkable net income of $13.47 billion for the most recent period, showcasing its robust profitability. Notably, the year-over-year increase in net income signals positive momentum for future performance. With an operating margin of 99.00%, META demonstrates exceptional operational efficiency and effective cost control, while a net profit margin of 34.46% highlights its strong capability to generate profits after accounting for all expenses.
In terms of liquidity, META maintains a healthy current ratio of 2.47, indicating that the company can comfortably cover its short-term liabilities. However, the cash to total assets ratio of 0.16 suggests some limitations in financial flexibility, which could expose the company to economic shocks.
From a valuation perspective, META appears reasonably priced with a forward P/E ratio of 21.90, reflecting a fair valuation relative to expected earnings growth. The price-to-sales ratio of 8.91 indicates that the stock is valued fairly in relation to its revenue generation. Furthermore, an impressive earnings growth rate of 73.20% points to strong future earnings potential.
Growth metrics also support a positive outlook, with a revenue growth of 7.18% year-over-year, indicating increasing demand for META’s products and services. The company’s operational efficiency is further underscored by its high operating and net profit margins, while a robust free cash flow of $32.01 billion provides ample resources for investments, debt reduction, or dividends.
Shareholder returns are bolstered by significant stock repurchases totaling $24.63 billion, which can enhance earnings per share by reducing the number of shares outstanding. The average ordinary shares outstanding at 2.56 billion suggest a stable shareholder base.
On the balance sheet, META’s debt-to-equity ratio of 0.29 indicates a manageable level of leverage, supported by strong profitability. However, the average total debt of $37.06 billion warrants further analysis to understand its composition and terms. The average tangible book value of $126.12 billion reflects a strong net worth after liabilities.
In terms of cash flow, META’s average capital expenditures of $23.14 billion indicate ongoing investments in growth and expansion, while positive net cash from financing of $5.39 billion suggests the company is effectively raising capital for growth or debt reduction.
Overall, META’s financial metrics paint a picture of a strong and well-managed company with solid growth prospects, efficient operations, and a healthy balance sheet. The positive trends in revenue and net income, along with strong profitability margins, support a strong buy recommendation. Investors looking for a robust investment opportunity may find META to be an attractive option.
Financial Health
🟢 Net Income for the most recent period was $13.47 billion, indicating strong profitability.
🟢 Year-over-year net income increased, which is a positive sign for future performance.
🟢 Operating Margin of 99.00% suggests exceptional operational efficiency and cost control.
🟢 Net Profit Margin of 34.46% reflects the company’s strong ability to generate profits after all expenses.
🟢 Current Ratio of 2.47 indicates a healthy liquidity position, suggesting the company can comfortably cover its short-term liabilities.
🔴 Cash to Total Assets Ratio of 0.16 may indicate limited financial flexibility and vulnerability to economic shocks.
Valuation
🟢 Forward P/E ratio of 21.90 suggests reasonable valuation relative to expected earnings growth.
🟢 Price-to-Sales Ratio of 8.91 indicates that the stock may be valued fairly in relation to its revenue generation.
🟢 Earnings Growth of 73.20% is impressive, indicating strong future earnings potential.
Growth and Profitability
🟢 Revenue Growth of 7.18% year-over-year suggests moderate growth, which is positive for stock price appreciation.
🟢 Operating Margin of 99.00% and Net Profit Margin of 34.46% demonstrate the company’s strong operational efficiency and profitability.
🟢 Free Cash Flow of $32.01 billion indicates that the company has ample cash available for investments, debt reduction, or dividends.
Shareholder Information
🟢 Stock Repurchases of $24.63 billion can be a positive signal as it reduces the number of shares outstanding, potentially boosting earnings per share.
🟢 Average Ordinary Shares Outstanding at 2.56 billion indicates a stable shareholder base.
Income Statement
🟢 Total Revenue for the most recent period was $39.07 billion, showing strong sales performance.
🟢 Year-over-year revenue growth of 7.18% indicates increasing demand for products or services.
Balance Sheet
🟢 Debt-to-Equity Ratio of 0.29 suggests a moderate level of leverage, which is manageable given the company’s profitability.
🔴 Average Total Debt of $37.06 billion warrants further analysis to understand its composition and terms.
🟢 Average Tangible Book Value of $126.12 billion indicates a strong net worth after liabilities.
Cashflow
🟢 Average Capital Expenditures of $23.14 billion suggest the company is investing in growth and expansion.
🟢 Positive Net Cash from Financing of $5.39 billion indicates the company is raising capital for growth or debt reduction.
Overall, the financial metrics indicate a strong and well-managed company with solid growth prospects, efficient operations, and a healthy balance sheet. The positive trends in revenue and net income, along with strong profitability margins, support a strong buy recommendation.
META News Analysis
META News: A mixed outlook for investors.
The news surrounding Meta Platforms (META) presents a combination of positive and negative developments. While there are strong endorsements for META as part of the “Magnificent Seven” stocks, there are also serious allegations against the company that could impact its reputation and stock performance. Investors should weigh these factors carefully.
🟢 The Motley Fool predicts that META will remain an excellent AI buy, indicating strong confidence in its future performance within the tech sector.
🟢 META is highlighted as one of the “Magnificent Seven” stocks, suggesting it has strong growth potential alongside other tech giants like Nvidia and Microsoft.
🔴 However, lawmakers have accused Meta of approving online ads for illegal substances, which could lead to regulatory scrutiny and damage the company’s reputation.
🟢 Mark Zuckerberg’s involvement in mentoring a startup founder showcases his commitment to innovation and support for the tech community, which could enhance META’s image.
🔴 The delay in Nvidia’s Blackwell chips could indirectly affect META, as it relies on advanced technology for its AI initiatives.
🟢 The recent amendments to a controversial California AI bill may alleviate some regulatory fears for tech companies, including META, potentially leading to a more favorable business environment.
🔴 The overall sentiment is mixed, with positive endorsements countered by serious allegations, suggesting that investors should proceed with caution.
META Holders Analysis
The financial health of META shows a mixed outlook, with strong institutional backing but concerning insider selling activity. This suggests a cautious buy recommendation for the next month.
🟢 META has a **high institutional ownership** at **79.02%**, indicating significant interest from large investors, which typically reflects confidence in the company’s future performance. The presence of **5163 institutional holders** adds to the diversification and stability of ownership.
🔴 However, the **insider ownership is very low at 0.17%**, which may indicate a lack of confidence from company management or a high degree of external control. This could be a red flag for potential investors.
🔴 Recent insider transactions show a **consistent pattern of selling**, particularly by CEO Mark Zuckerberg, who has sold shares at various price points ranging from **485.17 to 533.40**. This could signal a lack of confidence in the stock’s near-term performance or a strategy to liquidate for personal reasons.
🟡 Despite the selling, the overall market sentiment remains cautiously optimistic, as institutional investors continue to hold significant stakes. The stock’s performance over the next month may be influenced by broader market trends and the company’s upcoming earnings report.
META Analyst Ratings
The analyst ratings for META have shown a strong positive trend, with a significant number of analysts recommending a buy or strong buy. In the last month, there were 20 strong buy ratings, 35 buy ratings, 6 hold ratings, and only 2 sell ratings. This indicates a robust bullish sentiment among analysts. 🟢
The recent upgrades from firms such as Tigress Financial and Loop Capital reinforce this positive outlook. The consistent recommendation for buy and strong buy from multiple firms suggests that analysts are confident in META’s growth potential.
Looking ahead, the forecast for the next month appears favorable, with expectations of continued upward momentum. The stock price could potentially rise by 5-10% based on the current analyst sentiment and market conditions.
Overall, the strong buy and buy recommendations, coupled with the high confidence level, suggest that META is well-positioned for positive performance in the near term.
META Economic Analysis
Based on the US economic and market data:
🟢 The **unemployment rate** has decreased to **4.1%**, indicating a strengthening labor market which typically leads to increased consumer spending. This is positive for Meta as it could enhance advertising revenues across its platforms.
🟢 **Retail sales** have shown a significant increase, with the latest figure at **627,510**, suggesting robust consumer demand. This is likely to benefit Meta’s advertising business, as higher consumer spending often correlates with increased ad budgets from businesses.
🔴 The **Federal Funds Rate** remains high at **5.33%**, which could lead to increased borrowing costs for consumers and businesses. This may dampen overall economic growth and could negatively impact advertising budgets in the longer term.
🟡 The **CPI** shows inflation at **314.540**, which is relatively stable but still above the Federal Reserve’s target. This could lead to continued scrutiny on interest rates, impacting growth stocks like Meta.
🟢 Meta’s **trailing PE ratio** of **26.95** and **forward PE ratio** of **21.90** suggest that the stock is reasonably valued compared to its growth potential, especially given its recent earnings growth of **73%**.
Overall, while there are some concerns regarding interest rates and inflation, the positive indicators in employment and retail sales suggest a favorable environment for Meta’s business in the near term. Therefore, I recommend a **buy** for the next month, with a target price around **550**, reflecting a potential upside from the current price of **527.42**.
Disclaimer
Investors may consider the AI predictions and news summaries as one factor in their investment decisions alongside their own research and risk tolerance.

