PCG Stock Analysis: A Mixed Outlook Ahead!
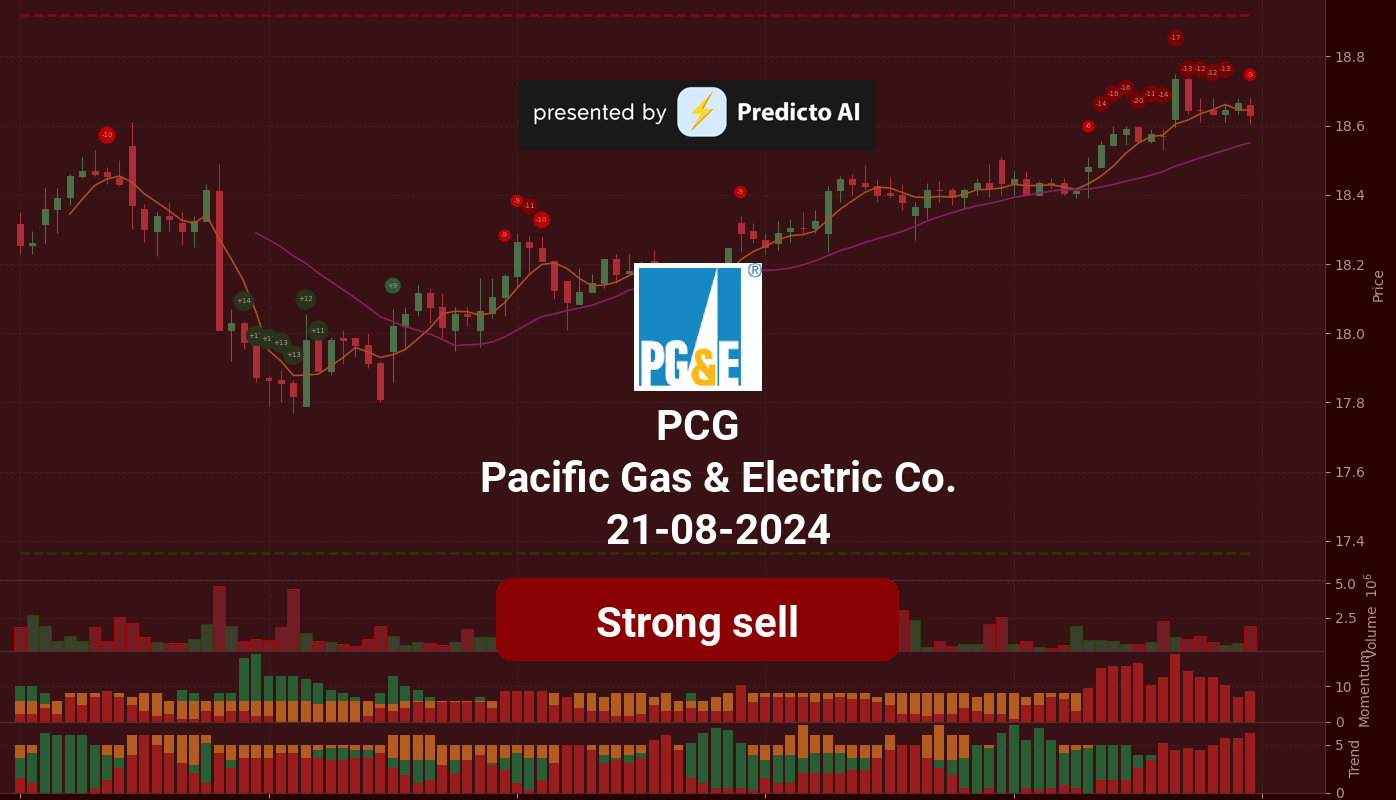
🔴 Recommendation: PCG is currently rated a Strong Sell, reflecting significant concerns despite some bullish trends in the market.
📈 Key Highlights:
Financial Health: Net income of $524 million, but with a year-over-year decrease raising profitability concerns.
Debt Levels: High Debt-to-Equity Ratio of 2.31, indicating substantial financial risk.
Valuation Metrics: Forward P/E ratio of 12.50 suggests potential undervaluation compared to the market.
⚠️ Caution Flags:
Liquidity Risk: Current Ratio at 0.38 indicates challenges in meeting short-term obligations.
Negative Cash Flow: Free Cash Flow is negative at -$6.31 billion, raising concerns about funding operations.
As we delve deeper into the analysis, we will explore the price trends, momentum indicators, financial health, valuation metrics, and the broader market context that shapes the outlook for PCG stock. Stay tuned for a comprehensive breakdown of what investors need to know! 👇
PCG Price Analysis

| Positive Momentum Signals | Negative Momentum Signals | Hold Momentum Signals |
|---|---|---|
|
|
| Positive Trend Signals | Negative Trend Signals | Hold Trend Signals |
|---|---|---|
|
|
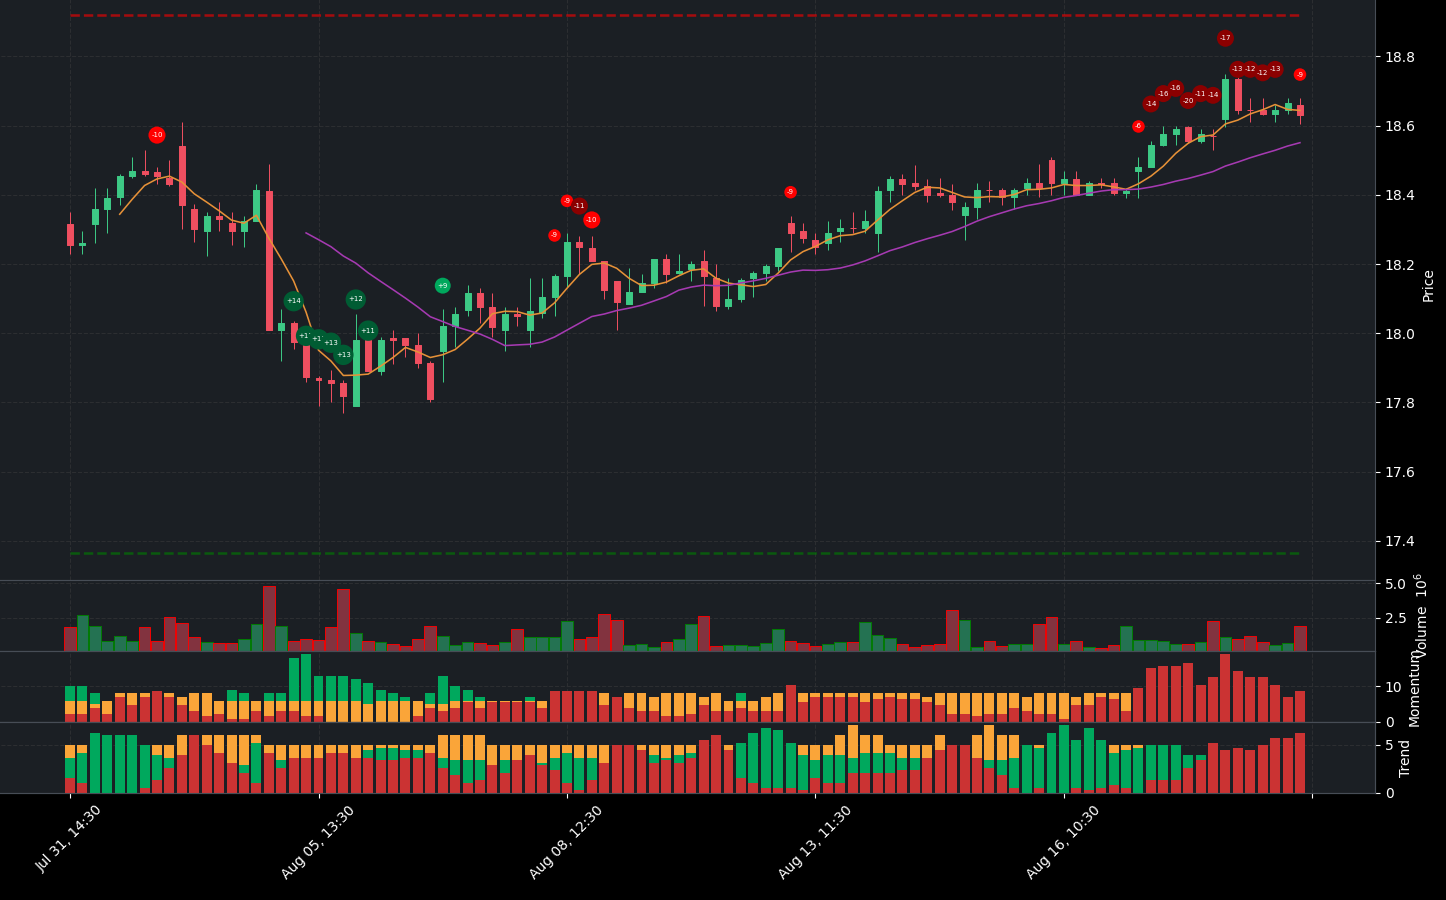
PCG stock presents a complex financial picture, characterized by both bullish and bearish indicators. Currently, the stock is rated a strong sell, reflecting significant concerns despite some positive trends.
On the positive side, PCG is exhibiting a bullish trend as the price is above both the 50-day and 200-day Exponential Moving Averages (EMAs), indicating a strengthening bullish trend. Additionally, the price is above the Supertrend indicator, further supporting the notion of an upward trajectory. However, caution is warranted as the stock is closer to resistance, which may limit further upward movement.
Momentum indicators tell a different story. The Stochastic RSI shows a bearish crossover, suggesting potential downward pressure. Furthermore, the On-Balance Volume (OBV) is decreasing, indicating that high volume is not supporting the current price levels, which could signal weakening buying interest. The MACD has also shown a negative histogram crossover, reinforcing the bearish sentiment.
While the price is currently above the middle band of its Bollinger Bands, it is also noted to be below the upper band, suggesting that while there is an uptrend, the stock may be approaching overbought conditions. This duality of indicators creates a challenging environment for investors.
In summary, while PCG shows some signs of a bullish trend, the negative momentum and trend indicators raise significant red flags. Investors should exercise caution, as the current market conditions suggest that a strong sell recommendation is appropriate until clearer signals of recovery or stability emerge.
PCG Fundamental Analysis
PCG’s recent financial performance presents a mixed picture, with several concerning indicators that could impact its future viability. The company reported a net income of $524 million for the most recent period, which, while indicating profitability, reflects a year-over-year decrease that raises questions about its future earnings potential.
A significant concern is the high debt-to-equity ratio of 2.31, suggesting that the company is heavily leveraged and may face challenges during economic downturns. Additionally, the current ratio is low at 0.38, indicating potential liquidity risks and difficulties in meeting short-term obligations. The cash to total assets ratio is very low at 0.01, which may limit the company’s financial flexibility and expose it to economic shocks.
On the valuation front, there are some positive signs. The forward P/E ratio of 12.50 suggests that the stock may be undervalued compared to the market, while the price-to-sales ratio of 1.97 indicates a reasonable valuation relative to sales. Furthermore, the company has demonstrated strong earnings growth of 26.30%, which reflects positive business performance.
In terms of growth and profitability, PCG has shown revenue growth of 2.13%, indicating moderate growth that could still support stock price appreciation. However, the net profit margin is low at 8.75%, which could be a concern for investors regarding overall profitability. On a more positive note, the operating margin of 100.00% suggests efficient operations and effective cost control.
Shareholder information reveals some potential drawbacks, such as a high average ordinary shares outstanding at 2.57 billion, which could dilute earnings per share. Additionally, the average treasury shares of 76.65 million indicate limited buyback activity, which may not support share price appreciation.
Looking at the income statement, total revenue for the most recent period was $5.99 billion, showcasing a solid revenue base. However, the modest year-over-year revenue growth of 2.13% suggests potential challenges in increasing sales. The net interest income is negative at $610 million, indicating that the company is paying more in interest on its debts than it is earning on its assets.
The balance sheet reveals high levels of debt, with an average net debt of $55.46 billion and an average total debt of $57.72 billion, raising concerns about the company’s ability to service its debt obligations. On a positive note, the average tangible book value of $24.98 billion indicates a solid net worth after liabilities.
Cash flow analysis shows troubling signs, with free cash flow being negative at -$6.31 billion, raising concerns about the company’s ability to fund operations and growth. However, the average capital expenditures of $8.67 billion suggest that the company is investing in growth and expansion.
Overall, while there are some positive indicators such as strong earnings growth and efficient operations, the high debt levels, low liquidity, and negative free cash flow raise significant concerns about PCG’s financial health and future performance. Investors should approach this stock with caution and consider the potential risks before making any investment decisions.
Financial Health
🔴 Net Income for the most recent period was $524 million, indicating profitability but with a year-over-year decrease, raising concerns about future profitability.
🔴 The Debt-to-Equity Ratio is high at 2.31, suggesting significant financial risk and potential challenges in economic downturns.
🔴 Current Ratio is low at 0.38, indicating potential liquidity risk and challenges in meeting short-term obligations.
🔴 Cash to Total Assets Ratio is very low at 0.01, which may indicate limited financial flexibility and vulnerability to economic shocks.
Valuation
🟢 Forward P/E ratio is 12.50, suggesting potential undervaluation compared to the market.
🟢 Price-to-Sales Ratio of 1.97 indicates reasonable valuation relative to sales.
🟢 Earnings Growth of 26.30% is strong, indicating positive business performance.
Growth and Profitability
🟢 Revenue Growth of 2.13% suggests moderate growth, which could still be positive for the stock price.
🔴 Net Profit Margin is low at 8.75%, which could be a concern for investors regarding profitability.
🟢 Operating Margin of 100.00% indicates efficient operations and good cost control.
Shareholder Information
🔴 Average Ordinary Shares Outstanding is high at 2.57 billion, which could dilute earnings per share.
🔴 Average Treasury Shares of 76.65 million indicates limited buyback activity, which may not support share price appreciation.
Income Statement
🟢 Total Revenue for the most recent period was $5.99 billion, showing a solid revenue base.
🔴 Year-over-year revenue growth of 2.13% is modest, indicating potential challenges in increasing sales.
🔴 Net Interest Income is negative at $610 million, suggesting the company is paying more in interest on its debts than it is earning on its assets.
Balance Sheet
🔴 Average Net Debt is high at $55.46 billion, warranting further investigation into its impact on financial flexibility.
🔴 Average Total Debt is also high at $57.72 billion, raising concerns about the company’s ability to service its debt obligations.
🟢 Average Tangible Book Value of $24.98 billion indicates a solid net worth after liabilities.
Cashflow
🔴 Free Cash Flow is negative at -$6.31 billion, raising concerns about the company’s ability to fund operations and growth.
🟢 Average Capital Expenditures of $8.67 billion suggest the company is investing in growth and expansion.
Overall, while there are some positive indicators such as strong earnings growth and efficient operations, the high debt levels, low liquidity, and negative free cash flow raise significant concerns about the company’s financial health and future performance.
PCG News Analysis
PG&E (PCG) presents a mixed outlook for investors based on recent news. While there are positive community engagement initiatives, the overall market sentiment and external factors may temper expectations.
Summary of PG&E news indicates a blend of community support and strategic developments. The awarding of scholarships and hosting of an innovation summit are positive community engagement efforts. However, the broader market context and ongoing challenges in the energy sector may limit immediate upside potential.
🟢 PG&E has awarded scholarships to 60 students across Northern and Central California, which helps ease college costs for families. This initiative reflects positively on the company’s community engagement and corporate social responsibility.
🟢 The role of battery storage in the energy transition is gaining attention, indicating that PG&E may be positioning itself to benefit from advancements in energy storage technology. This could enhance its operational efficiency and sustainability efforts.
🟢 An article suggests that PG&E is worth watching, hinting at potential growth opportunities. This could attract investor interest, especially if the company continues to improve its operational metrics.
🔴 The Zacks Analyst Blog highlights PG&E among other companies, which may indicate that it is not the sole focus of analysts, potentially diluting investor attention.
🔴 The mention of PG&E in a list of year-to-date laggards suggests that the stock has underperformed compared to its peers, which could raise concerns for investors looking for immediate returns.
🔴 The upcoming Innovation Summit on November 13 may provide insights into PG&E’s future strategies, but it also indicates that the company is still in the process of adapting to industry changes.
PCG Holders Analysis
The financial landscape for PCG indicates a generally positive outlook, but caution is warranted due to mixed signals from insider activities and the high level of institutional ownership.
🟢 PCG has a **high institutional ownership** at **78.04%**, which reflects strong interest from large investors. This can provide stability and confidence in the stock’s performance.
🟡 The **low insider ownership** of **2.73%** suggests that management may not be fully aligned with shareholder interests, which could lead to potential conflicts in decision-making.
🟢 The **number of institutional holders** stands at **960**, indicating a broad base of institutional investment and diversification, which is typically a positive sign for stock stability.
🟡 Recent **insider transactions** show a mix of purchases and sales, with a notable amount of insider selling. This could indicate a lack of confidence among insiders, although it may also be driven by personal financial planning rather than company performance concerns.
🔴 The **high institutional ownership** could lead to increased volatility if major investors decide to sell, which is a risk factor to consider.
🔴 The **insider purchases** over the last six months are relatively low compared to the sales, which may raise concerns about the future outlook from those closest to the company.
PCG Analyst Ratings
The analyst ratings for PCG show a generally positive outlook, with a total of 1 strong buy, 7 buy, and 6 hold recommendations over the last month. This indicates a favorable sentiment among analysts, although there are no sell or strong sell ratings, which suggests a lack of bearish sentiment.
🟡 In the past month, the distribution of ratings indicates a solid base of support for the stock, with 1 strong buy and 7 buy ratings. The consistent upgrades from firms like Barclays and Wells Fargo reinforce this positive outlook.
🟢 Given the current analyst ratings and the absence of negative recommendations, it is likely that PCG will see moderate growth in the next month. However, the medium confidence level suggests that investors should remain cautious and monitor market conditions closely. A potential price target could be around $15 to $17, reflecting a reasonable upside based on current trends.
PCG Economic Analysis
Based on the US economic and market data:
🟢 The recent **unemployment rate** has increased to **4.3%**, which is still relatively low, indicating a stable labor market. This stability can lead to consistent demand for utilities like PG&E, as consumers are likely to maintain their energy consumption.
🟡 **Retail sales** have shown an increase, with the latest figure at **627,510**, suggesting that consumer spending is holding up. This could positively impact PG&E’s revenue as higher retail sales often correlate with increased energy consumption.
🔴 The **Federal Funds Rate** remains high at **5.33%**, which could lead to increased borrowing costs for PG&E. This may affect their capital expenditures and overall profitability in the short term.
🟢 The **CPI** shows a slight increase, but inflation appears to be stabilizing, which could ease some pressure on the Federal Reserve to raise rates further. This stabilization could benefit utility companies like PG&E, as it may lead to more predictable operating costs.
🔴 The **debt-to-equity ratio** of **228.678** indicates that PG&E is highly leveraged, which poses risks, especially in a rising interest rate environment. However, the company’s ability to generate revenue from its regulated utility operations provides a buffer against these risks.
Overall, while there are some concerns regarding interest rates and debt levels, the stable consumer demand and recent retail sales growth provide a positive outlook for PG&E’s stock price in the coming month. The target mean price of **21.52** suggests potential upside from the current price of **18.63**.
Disclaimer
Investors may consider the AI predictions and news summaries as one factor in their investment decisions alongside their own research and risk tolerance.


