
QCOM Stock Analysis: A Mixed Bag of Opportunities and Risks
🔴 Recommendation: Qualcomm Inc. (QCOM) is currently rated as a buy, but investors should approach with caution due to a blend of positive and negative indicators.
📈 Key Highlights:
Momentum Indicators: A bullish crossover in StochRSI and a potential bottom indicated by WaveTrend being oversold suggest a possible rebound in stock price.
Financial Health: Despite a positive net income of $2.11 billion, concerns arise from a year-over-year decrease in net income and a high debt-to-equity ratio of 1.42.
Valuation Metrics: A forward P/E ratio of 14.95 hints at potential undervaluation, while a price-to-sales ratio of 4.96 raises questions about overvaluation.
⚠️ Caution Flags:
Bearish Trends: The stock is trading below key moving averages and the Supertrend level, indicating a prevailing downtrend.
Analyst Sentiment: Recent downgrades and a lowered price target to $160 from $215 reflect growing skepticism about QCOM’s near-term performance.
Let’s dive into the details as we break down the price trends, indicators, financial health, valuation metrics, and more 👇
QCOM Price Analysis
| Positive Momentum Signals | Negative Momentum Signals | Hold Momentum Signals |
|---|---|---|
|
|
|
| Positive Trend Signals | Negative Trend Signals | Hold Trend Signals |
|---|---|---|
|
|
|
Qualcomm Inc. (QCOM) presents a complex investment landscape characterized by both positive and negative indicators. Currently, the stock is rated as a buy, reflecting some optimism in the market. Positive momentum indicators include a bullish crossover in StochRSI and a potential bottom indicated by WaveTrend being oversold. These suggest that the stock may be poised for a rebound.
However, caution is warranted due to several negative momentum indicators. The WaveTrend shows a bearish divergence, which could signal a potential reversal in price direction. This divergence indicates that while prices may be rising, the underlying momentum is weakening, which could lead to a pullback.
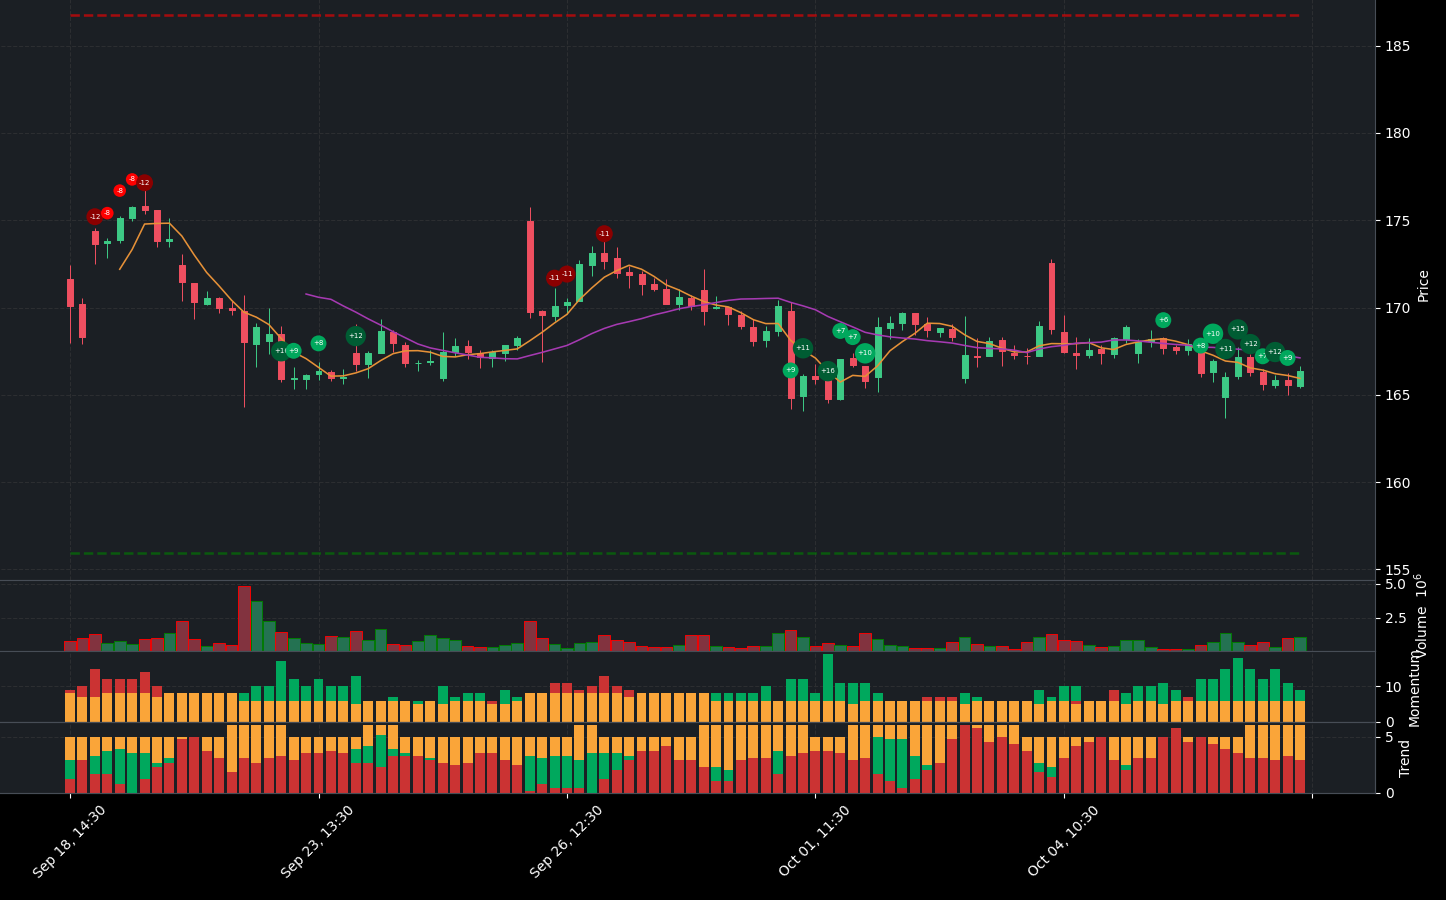
On the trend front, there are mixed signals. The On-Balance Volume (OBV) is increasing, supported by high volume, and the MACD has shown a positive histogram crossover, both of which are typically bullish signs. Yet, the stock is currently trading below the middle band of its Bollinger Bands, indicating a downtrend, and it is also below both the 50-day and 200-day Exponential Moving Averages (EMAs), which further confirms a bearish trend. The Supertrend indicator is also bearish, reinforcing the notion that the stock is in a downtrend.
The recent price action shows that QCOM is below the Supertrend level, which adds to the bearish sentiment. Despite the positive momentum indicators, the overall trend suggests that investors should be cautious, as the stock is in a downtrend but may be experiencing oversold conditions.
In summary, while Qualcomm Inc. has some positive momentum indicators that suggest a potential buying opportunity, the prevailing bearish trends and negative momentum signals indicate that investors should proceed with caution. A hold or careful buy strategy may be advisable until clearer signs of a trend reversal emerge.
QCOM Fundamental Analysis
QCOM’s recent financial performance presents a mixed picture, but overall, it leans towards a positive outlook. The company reported a net income of $2.11 billion for the most recent period, indicating profitability. However, it is important to note that year-over-year net income has decreased, which raises concerns about future profitability. On a positive note, QCOM boasts an operating margin of 100.00%, reflecting efficient operations and strong cost control, alongside a net profit margin of 22.44%, showcasing its ability to generate profits after all expenses.
Despite these strengths, there are significant concerns regarding the company’s financial health. The average net debt stands at a high $7.33 billion, which necessitates further investigation into its impact on financial flexibility. Additionally, a debt-to-equity ratio of 1.42 raises red flags about financial risk. On the liquidity front, the current ratio of 2.59 indicates a healthy position, suggesting that QCOM can comfortably cover its short-term liabilities. However, a low cash to total assets ratio of 0.15 points to limited financial flexibility.
In terms of valuation, the forward P/E ratio of 14.95 suggests potential future undervaluation, indicating that the stock may be a good buy. Conversely, the price-to-sales ratio of 4.96 is relatively high, hinting at potential overvaluation.
Looking at growth and profitability, QCOM demonstrates strong performance with an earnings growth of 17.40% and revenue growth of 11.10%, indicating increasing demand for its products or services. The company also maintains high profit margins and operating margins of 24.44%, reflecting strong operational efficiency.
From a shareholder perspective, QCOM has positive net cash from financing amounting to $11.75 billion, which could be utilized for growth or debt reduction. Furthermore, stock repurchases totaling $2.98 billion signal confidence in the company’s future and may enhance earnings per share (EPS).
On the income statement front, total revenue for the most recent period was $9.39 billion, reinforcing a solid revenue base. The operating margin remains impressive at 100.00%, and the net profit margin of 22.44% underscores the company’s profitability.
However, the balance sheet reveals some concerns, with an average total debt of $15.27 billion, necessitating further analysis to understand its implications on financial health. The average tangible book value of $10.78 billion also warrants closer examination over time. The average ordinary shares outstanding of 1.12 billion indicates a stable share structure, although fluctuations could impact stock price.
In terms of cash flow, QCOM shows promise with an average capital expenditures of $1.75 billion, indicating investment in growth and expansion. Positive free cash flow suggests that the company has cash available for investments, debt reduction, or dividends.
In summary, while there are concerns regarding net income trends and high debt levels, QCOM’s strong profitability metrics, growth potential, and positive cash flow support a buy recommendation. Investors should consider these factors while weighing the risks associated with the company’s financial structure.
Financial Health
🟢 Net Income for the most recent period was positive at $2.11 billion, indicating profitability.
🔴 Year-over-year net income decreased, which raises concerns about the company’s future profitability.
🟢 Operating Margin of 100.00% suggests efficient operations and good cost control.
🟢 Net Profit Margin of 22.44% reflects the company’s ability to generate profits after all expenses.
🔴 Average Net Debt is high at $7.33 billion, warranting further investigation into its impact on financial flexibility.
🔴 Debt-to-Equity Ratio of 1.42 raises concerns about financial risk.
🟢 Current Ratio of 2.59 indicates a healthy liquidity position, suggesting the company should be able to cover its short-term liabilities comfortably.
🔴 Cash to Total Assets Ratio is low at 0.15, indicating limited financial flexibility.
Valuation
🟢 Forward P/E ratio of 14.95 suggests potential future undervaluation, indicating the stock may be a good buy.
🔴 Price-to-Sales Ratio of 4.96 is relatively high, suggesting potential overvaluation.
Growth and Profitability
🟢 Earnings Growth of 17.40% is strong, indicating positive business performance.
🟢 Revenue Growth of 11.10% suggests increasing demand for products or services.
🟢 High profit margins demonstrate the company’s ability to generate profits efficiently.
🟢 High operating margins of 24.44% indicate strong operational efficiency.
Shareholder Information
🟢 Positive net cash from financing of $11.75 billion indicates the company is raising capital, which could be used for growth or debt reduction.
🟢 Stock repurchases of $2.98 billion can be a positive signal as it reduces the number of shares outstanding and may boost earnings per share (EPS).
Income Statement
🟢 Total revenue for the most recent period was $9.39 billion, indicating a solid revenue base.
🟢 Operating Margin of 100.00% suggests efficient operations.
🟢 Net Profit Margin of 22.44% reflects the company’s ability to generate profits after expenses.
Balance Sheet
🔴 Average Total Debt is high at $15.27 billion, further analysis is needed to understand its impact on the company’s financial health.
🔴 Average Tangible Book Value of $10.78 billion suggests a need for further analysis of its trend over time.
🟢 Average Ordinary Shares Outstanding of 1.12 billion indicates a stable share structure, although fluctuations could influence stock price.
Cashflow
🟢 Average Capital Expenditures of $1.75 billion suggest the company is investing in growth and expansion.
🟢 Positive free cash flow indicates the company has cash available for investments, debt reduction, or dividends.
Overall, while there are some concerns regarding net income trends and high debt levels, the company’s strong profitability metrics, growth potential, and positive cash flow support a buy recommendation.
QCOM News Analysis
Qualcomm (QCOM) faces significant headwinds with recent downgrades and concerns over its market position.
Summary of Qualcomm news indicates a challenging outlook for the company. The recent price target reduction and downgrades from analysts signal a lack of confidence in QCOM’s near-term performance. Additionally, concerns regarding its relationship with Apple and competition in the AI sector further complicate its prospects. Investors should be cautious given the negative sentiment surrounding the stock.
🔴 Qualcomm price target lowered to $160 from $215 at Cantor Fitzgerald. This significant reduction reflects analysts’ concerns about QCOM’s growth potential and market challenges.
🔴 KeyBanc has downgraded Qualcomm, indicating a bearish outlook. This downgrade adds to the negative sentiment and suggests that analysts are losing confidence in the company’s ability to perform well in the current market environment.
🔴 An article discusses Qualcomm’s issues with Apple, highlighting potential risks to its revenue streams. The relationship with Apple is crucial for Qualcomm, and any problems could adversely affect its financial performance.
🟢 Despite the negative news, some analysts still view Qualcomm as a promising AI stock. This perspective suggests that there may be long-term potential if the company can navigate current challenges effectively.
🔴 A report indicates that Qualcomm shares could be 38% below their intrinsic value estimate. This suggests that the stock may be undervalued, but the underlying issues need to be addressed for any recovery to occur.
QCOM Holders Analysis
The financial landscape for QCOM presents a mixed outlook, with strong institutional backing but concerning insider ownership levels.
🟢 QCOM has a robust institutional ownership at **80.56%**, indicating significant interest from large investors, which typically suggests confidence in the company’s future performance. This high level of institutional ownership can provide stability and support for the stock price.
🔴 However, the **insider ownership is only 0.09%**, which is very low. This could imply a lack of confidence from company management or a high degree of external control, raising concerns about the alignment of interests between management and shareholders.
🟡 The number of institutional holders stands at **3567**, reflecting widespread interest and diversification in ownership. This can be a positive sign as it indicates that many institutions believe in the company’s potential.
🟡 Recent insider transactions show a mix of purchases and sales, with a slight inclination towards selling. This could be interpreted as insiders taking profits, which might not be a strong bullish signal.
🔴 The recent insider purchases are relatively low compared to the sales, which could indicate a lack of confidence among insiders regarding the stock’s near-term performance.
QCOM Analyst Ratings
The analyst ratings for QCOM show a mixed sentiment, with a notable number of hold ratings. Currently, there are 3 strong buy ratings, 7 buy ratings, 13 hold ratings, and no sell or strong sell ratings. This indicates a cautious outlook among analysts. 🔴 The recent downgrade by Keybanc from Overweight to Sector Weight suggests a potential concern regarding QCOM’s near-term performance. Additionally, the lack of strong buy recommendations indicates that analysts are not overly optimistic at this time.
🟡 Over the past month, the ratings have shifted slightly, with a total of 7 buy ratings and 1 sell rating, which reflects a more conservative approach from analysts. Given this mixed sentiment, it is likely that QCOM will experience moderate performance in the next month, with potential fluctuations around the current price level. The medium confidence level suggests that while there is some potential for growth, caution is advised due to the recent downgrades and overall neutral sentiment.
QCOM Economic Analysis
Based on the US economic and market data:
🟢 The **unemployment rate** has increased slightly to **4.3%**, but it remains relatively low, indicating a stable labor market that supports consumer spending. This is generally positive for technology companies like Qualcomm, as increased consumer spending can lead to higher demand for their products.
🟢 **Retail sales** have shown an increase to **627,510**, suggesting that consumer demand is holding up well. This is a positive indicator for Qualcomm’s revenue, particularly in the consumer electronics sector.
🔴 The **CPI** has remained high at **314.540**, indicating persistent inflationary pressures. This could lead to potential interest rate hikes by the Federal Reserve, which may negatively impact growth stocks like Qualcomm in the short term.
🟡 The **GDP** growth rate is stable, but the recent figures show a slight decline from previous quarters. This could indicate a cooling economy, which may affect Qualcomm’s growth prospects.
🟢 Qualcomm’s **dividend yield** of **2.04%** and a **payout ratio** of **41.56%** suggest that the company is returning value to shareholders, which is a positive sign for investors looking for income.
Overall, while there are some concerns regarding inflation and economic growth, the underlying demand for Qualcomm’s products remains strong. The company is well-positioned in the semiconductor industry, particularly with the ongoing expansion of 5G technology. Therefore, I recommend a **buy** for QCOM, with a target price range of **$170 to $180** over the next month, supported by the positive consumer spending trends and stable demand for technology products.
Disclaimer
Investors may consider the AI predictions and news summaries as one factor in their investment decisions alongside their own research and risk tolerance.


