TFC Stock Analysis: A Cautious Outlook Ahead!
🔴 Recommendation: TFC is currently presenting a mixed financial picture, with significant concerns overshadowing some positive indicators, leading to a strong sell recommendation.
📈 Key Highlights:
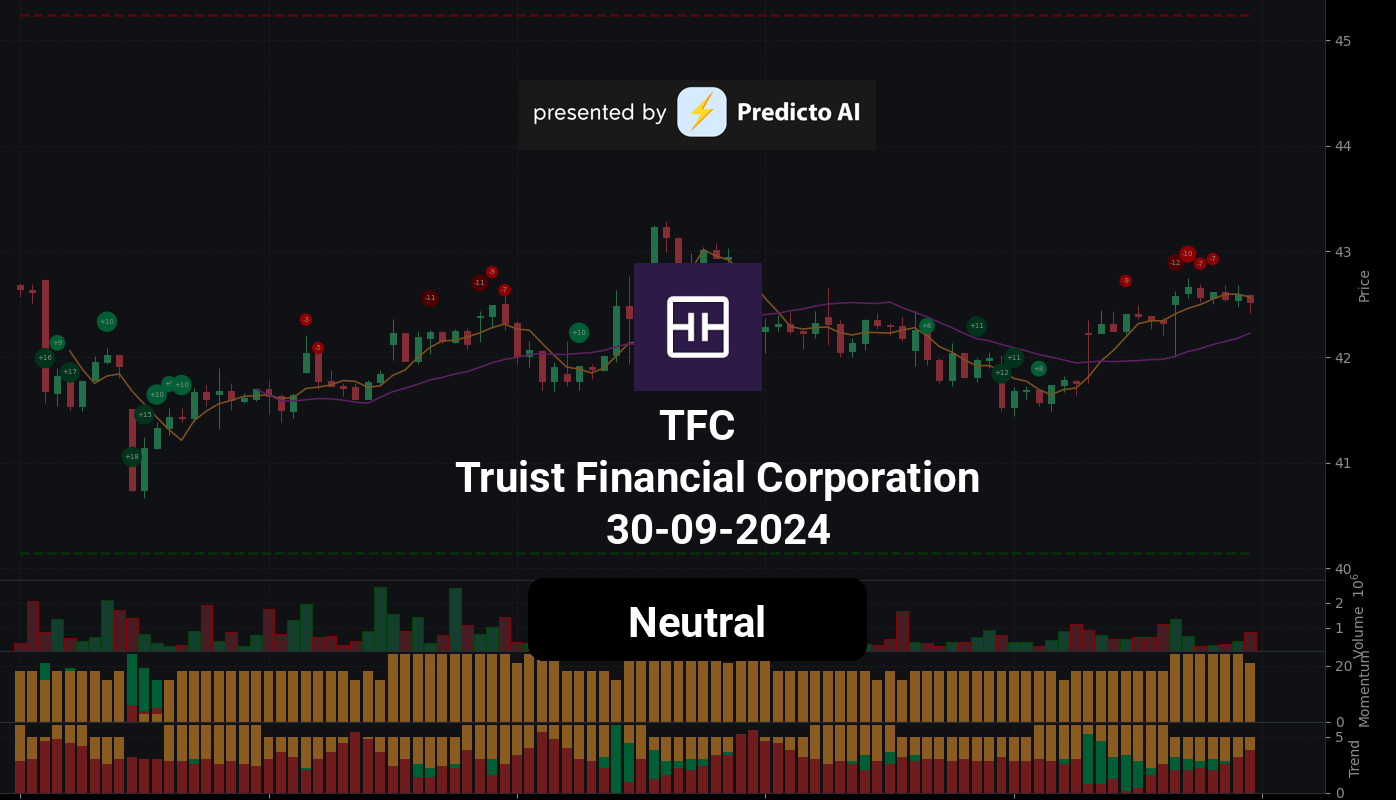
Technical Indicators: TFC is trading above key moving averages, indicating a strengthening bullish trend, but caution is warranted as momentum indicators signal potential reversals.
Financial Health: The company reported a negative net income of $-3.93 billion, raising serious questions about its profitability and financial stability.
Valuation Metrics: A Price-to-Sales Ratio of 4.00 suggests potential overvaluation, especially in light of declining revenue.
⚠️ Caution Flags:
High Debt Levels: A Debt-to-Equity Ratio of 2.30 indicates substantial financial leverage, increasing risk during economic downturns.
Negative Revenue Growth: Year-over-year revenue growth of -134.97% is alarming and could negatively impact the stock price.
Let’s dive into the details as we break down the price trends, indicators, financial health, valuation metrics, and more 👇
TFC Price Analysis
| Positive Momentum Signals | Negative Momentum Signals | Hold Momentum Signals |
|---|---|---|
|
|
| Positive Trend Signals | Negative Trend Signals | Hold Trend Signals |
|---|---|---|
|
|
|
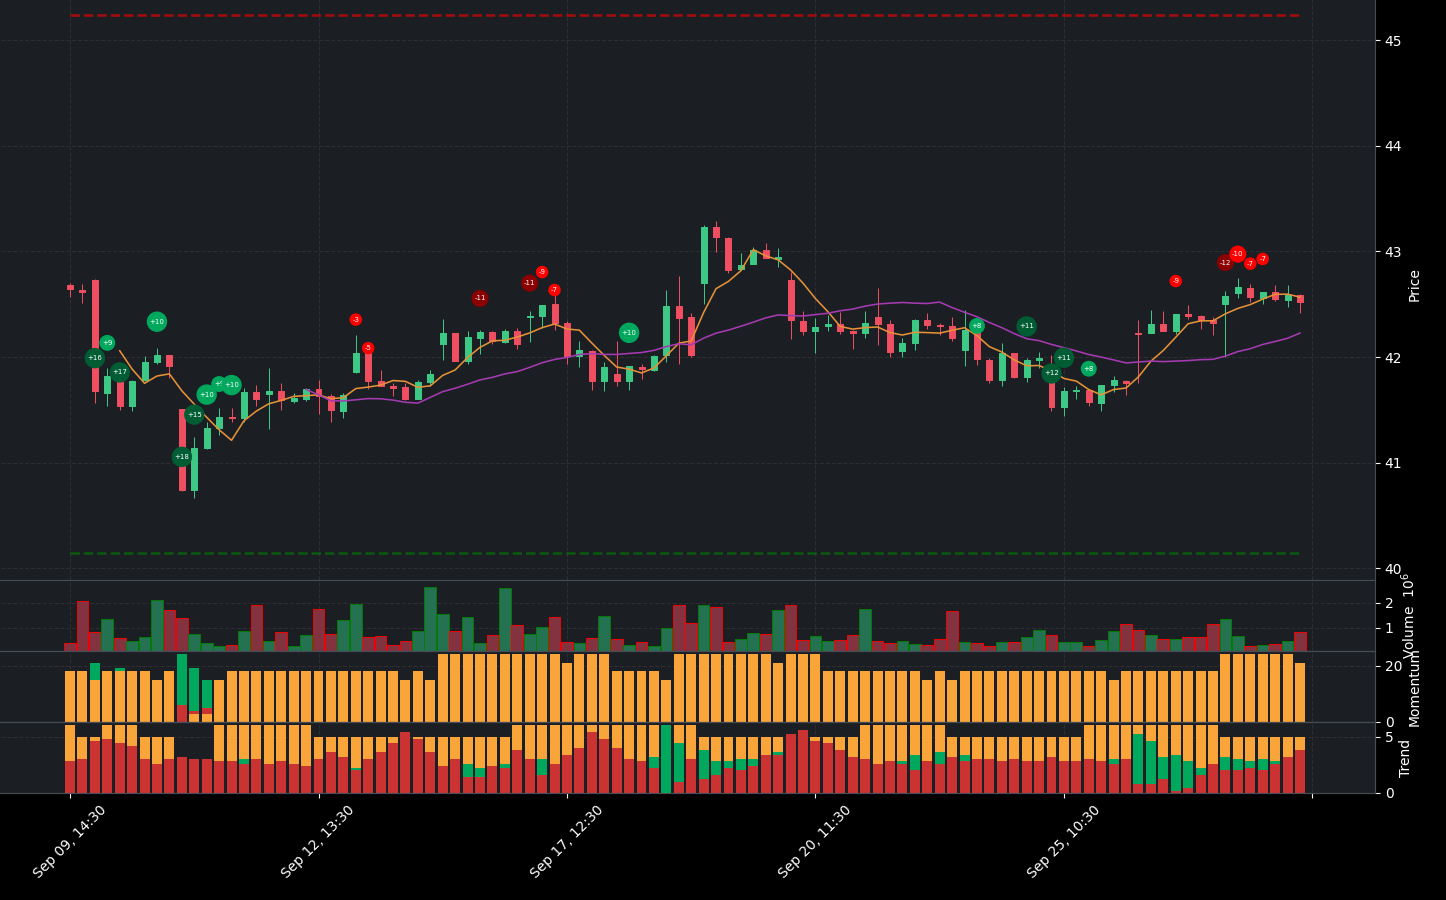
TFC stock presents a complex financial picture, characterized by both positive and negative indicators. On the positive side, the stock is currently trading above key moving averages, with the price above the 50-day EMA and the 200-day EMA, indicating a bullish trend that is strengthening. Additionally, the Supertrend indicator confirms a bullish trend, as the price remains above the Supertrend line. However, caution is warranted as the price is above the middle band but below the upper band, suggesting that while the stock is in an uptrend, it may be approaching overbought conditions.
Conversely, several negative momentum indicators raise concerns. The WaveTrend indicator has issued a sell signal with a confirmed crossover, which could indicate a potential reversal in momentum. Furthermore, the On-Balance Volume (OBV) is decreasing, suggesting that the volume behind price movements is weakening, and the MACD has shown a negative histogram crossover, which typically signals bearish momentum.
Given these mixed signals, investors should approach TFC stock with caution. While the bullish trends in moving averages and Supertrend are encouraging, the negative momentum indicators suggest that the stock may face challenges ahead. A hold or cautious buy recommendation may be prudent, as investors should monitor for clearer signals of sustained growth or potential reversals in momentum.
TFC Fundamental Analysis
TFC’s recent financial performance raises significant concerns for investors. The company reported a net income of -$3.93 billion for the most recent period, indicating substantial losses that cast doubt on its future profitability. This negative trend is compounded by a year-over-year net income decrease, which heightens worries about the company’s financial stability.
The company’s debt-to-equity ratio of 2.30 suggests a high level of financial leverage, increasing risk during economic downturns. Although TFC boasts a strong current ratio of 15.36, indicating a solid liquidity position, its cash to total assets ratio of 0.06 reveals limited financial flexibility and vulnerability to economic shocks.
Valuation metrics further amplify concerns, with a price-to-sales ratio of 4.00 suggesting potential overvaluation, especially in light of declining revenue. The forward P/E of 10.55 may not be attractive given the alarming negative earnings growth of -33.60%.
In terms of growth and profitability, TFC’s revenue has also taken a hit, with a negative revenue of -$1.69 billion and a staggering year-over-year revenue growth of -134.97%. While the company reports an impressive operating margin of 100.00%, this is overshadowed by the overall negative financial performance. The net profit margin of 232.94% appears misleading due to the negative net income, suggesting potential accounting anomalies or one-time gains.
Shareholder information reveals further red flags, with an average dilution earnings per share of -$3.93 billion, indicating significant dilution for existing shareholders. Although TFC has engaged in stock repurchases of $945.25 million, this may not be sufficient to offset dilution and could signal a lack of better investment opportunities.
The balance sheet presents additional concerns, with an average net debt of $28.32 billion raising questions about the company’s ability to service its debt obligations. The average total debt of $61.50 billion warrants further investigation into its composition and terms. However, the average tangible book value of $26.78 billion indicates a reasonable net worth after liabilities, though this needs to be compared with industry peers for context.
On a slightly positive note, TFC’s average capital expenditures of $511.25 million suggest investment in growth and expansion. Additionally, the company has reported positive net cash from financing activities of $49.16 billion, indicating that it is raising capital, which could be used for growth or debt reduction.
In summary, TFC’s financial performance is troubling, characterized by significant losses, declining revenue, and high debt levels. While there are some positive indicators, they are overshadowed by the overall negative trends. Therefore, a strong sell recommendation is warranted. Investors should exercise caution and thoroughly evaluate the company’s ability to navigate its challenges before considering any investment.
Financial Health
🔴 Net Income for the most recent period was negative at $-3.93 billion, indicating significant losses and raising concerns about the company’s future profitability.
🔴 Year-over-year net income decreased, which may further exacerbate worries regarding the company’s financial stability.
🔴 The Debt-to-Equity Ratio is high at 2.30, suggesting a substantial level of financial leverage and increased risk during economic downturns.
🟢 Current Ratio of 15.36 indicates a strong liquidity position, suggesting the company can comfortably cover its short-term liabilities.
🔴 Cash to Total Assets Ratio is low at 0.06, indicating limited financial flexibility and vulnerability to economic shocks.
Valuation
🔴 Price-to-Sales Ratio of 4.00 suggests potential overvaluation, especially given the declining revenue.
🔴 Forward P/E of 10.55 may not be attractive considering the negative earnings growth of -33.60%.
Growth and Profitability
🔴 Revenue for the most recent period was negative at $-1.69 billion, indicating a severe decline in sales.
🔴 Year-over-year revenue growth was -134.97%, which is alarming and could negatively impact the stock price.
🟢 Operating Margin of 100.00% suggests efficient operations, but this is overshadowed by the overall negative financial performance.
🔴 Net Profit Margin of 232.94% appears misleading due to the negative net income, indicating potential accounting anomalies or one-time gains.
Shareholder Information
🔴 Average Dilution Earnings per share was negative at $-3.93 billion, indicating that share-based compensation has significantly diluted earnings for existing shareholders.
🔴 Stock Repurchases of $945.25 million may not be sufficient to offset the dilution and could signal a lack of better investment opportunities.
Income Statement
🔴 The overall sentiment is neutral, but the negative trends in net income and revenue growth are concerning.
🔴 Operating margin is high at 235.16%, but this does not translate into actual profitability given the negative net income.
Balance Sheet
🔴 Average Net Debt is high at $28.32 billion, which raises concerns about the company’s ability to service its debt obligations.
🔴 Average Total Debt of $61.50 billion warrants further investigation into its composition and terms.
🟢 Average Tangible Book Value of $26.78 billion indicates a reasonable net worth after liabilities, but this needs to be compared with industry peers for context.
Cashflow
🟢 Average Capital Expenditures of $511.25 million suggest investment in growth and expansion, which is a positive sign.
🟢 Positive net cash from financing activities of $49.16 billion indicates the company is raising capital, which could be used for growth or debt reduction.
In summary, the company’s financial performance is concerning, with significant losses, declining revenue, and high debt levels. While there are some positive indicators, they are overshadowed by the overall negative trends. Therefore, a strong sell recommendation is warranted.
TFC News Analysis
Truist Financial Corporation (TFC) is facing a mixed set of news that could influence investor sentiment. While some news indicates potential challenges, there are also positive developments that may support the stock.
Summary of TFC news reveals a blend of challenges and opportunities. The downgrades and antitrust concerns present risks, but the philanthropic efforts and community support initiatives could enhance the company’s reputation and long-term value. Investors should weigh these factors carefully.
🔴 Truist has downgraded Analog Devices, Inc. (ADI) to Hold, indicating concerns about peak growth and challenging returns ahead. This could reflect broader market challenges that may impact TFC indirectly.
🔴 Aramark’s potential merger with Sodexo faces antitrust risks, which could create uncertainty in the market. Such risks can affect investor confidence in related sectors, including TFC.
🟢 The Truist Foundation has announced a $500,000 grant for Hurricane Helene relief efforts. This philanthropic initiative may enhance TFC’s public image and strengthen community ties, potentially leading to long-term benefits.
🔴 Truist Securities has downgraded Smartsheet to Hold from Buy, cutting the price target. This reflects a cautious outlook that may influence investor sentiment negatively.
🔴 Regeneron stock has slid after a court rejected an injunction against a biosimilar, which could indicate volatility in the biotech sector that may affect TFC’s performance indirectly.
🔴 A report suggests that two chip stocks have peaked, which could signal caution in the tech sector. This may have implications for TFC, especially if it is exposed to related markets.
🟢 The Truist Foundation has also announced a new Inspire Awards Challenge aimed at driving economic mobility. This initiative could foster goodwill and enhance TFC’s reputation as a socially responsible entity.
TFC Holders Analysis
The financial health of TFC presents a mixed outlook for the next month. While there are positive indicators, some concerns also exist that warrant a cautious approach.
🟢 TFC has a **high institutional ownership** at 73.94%, indicating strong interest from large investors. This level of institutional backing often provides stability and confidence in the stock’s performance.
🟡 The **very low insider ownership** at 0.28% raises concerns about management’s confidence in the company. This could suggest a lack of alignment between management and shareholder interests, which is a potential red flag.
🟢 The **large number of institutional holders** (1801) indicates a diversified ownership structure, which can help mitigate volatility and provide a buffer against sharp price movements.
🟡 Recent **insider transactions** show a mix of purchases and sales, with a slight inclination towards selling. This could indicate that insiders are taking profits or reallocating their investments, which may not be a strong vote of confidence.
🔴 The **high institutional ownership** could lead to increased volatility if major investors decide to sell, especially in uncertain market conditions.
🔴 The lack of significant insider purchases in recent months suggests that insiders may not see immediate value in buying more shares, which could be interpreted as a lack of confidence in the stock’s short-term prospects.
TFC Analyst Ratings
The analyst ratings for TFC show a mixed sentiment, with a notable number of hold ratings and a few upgrades. In the past month, there have been 4 strong buy ratings, 7 buy ratings, and 14 hold ratings, indicating a cautious approach from analysts. The lack of strong sell or sell ratings suggests that analysts do not foresee significant downside risk at this time.
🟡 The recent upgrade from Wolfe Research to Peer Perform is a positive sign, but the downgrade from Citigroup to Neutral indicates some concerns about the stock’s performance. Overall, the sentiment is neutral, reflecting a balance of optimism and caution.
🟢 Given the mixed analyst ratings and the recent upgrades, TFC is likely to maintain its current price range over the next month, with potential for slight upward movement if positive trends continue. However, the medium confidence level suggests that investors should remain vigilant for any changes in market conditions or further analyst actions.
TFC Economic Analysis
Based on the US economic and market data:
🔴 The recent increase in the unemployment rate to 4.3% from 4.1% indicates a slight deterioration in the labor market, which could lead to reduced consumer spending and negatively impact Truist Financial Corporation (TFC) as a regional bank.
🟡 Retail sales have shown a modest increase, but the overall growth is not robust enough to significantly boost TFC’s revenue in the short term.
🔴 The CPI data suggests inflationary pressures remain, which could lead to higher interest rates from the Federal Reserve, potentially squeezing profit margins for banks like TFC.
🟢 However, TFC’s dividend yield of approximately 4.9% remains attractive, providing some support for the stock price amidst economic uncertainties.
🔴 The profit margins for TFC are currently negative, which raises concerns about the company’s profitability in the near future.
Overall, while there are some positive aspects such as the attractive dividend yield, the negative trends in unemployment and profit margins, along with inflation concerns, suggest a cautious outlook for TFC over the next month. The stock may remain in a range between $40.45 and $46.77, with potential volatility depending on broader economic indicators.
Disclaimer
Investors may consider the AI predictions and news summaries as one factor in their investment decisions alongside their own research and risk tolerance.

