
TRP Stock Analysis: A Mixed Outlook Ahead!
🔴 Recommendation: TRP is currently presenting a complex financial picture, with a cautious hold recommendation as investors navigate through both positive and negative indicators.
📈 Key Highlights:
Oversold Condition: The WaveTrend indicator suggests TRP may be oversold, hinting at a potential recovery opportunity.
Bullish Long-Term Trend: The stock is trading above the 200-day EMA, indicating a strengthening bullish trend.
Strong Profit Margins: A robust net profit margin of 24.24% reflects the company’s ability to generate profits effectively.
⚠️ Caution Flags:
High Debt Levels: A concerning Debt-to-Equity Ratio of 3.96 raises potential risks regarding financial leverage.
Declining Revenue: Year-over-year revenue growth of -3.72% indicates a troubling trend that could impact future performance.
Liquidity Concerns: A Current Ratio of 0.65 suggests potential challenges in meeting short-term obligations.
As we delve deeper into the analysis, we will explore the price trends, indicators, financial health, valuation metrics, and more to provide a comprehensive view of TRP’s current standing and future prospects. Stay tuned! 👇
TRP Price Analysis
| Positive Momentum Signals | Negative Momentum Signals | Hold Momentum Signals |
|---|---|---|
|
|
|
| Positive Trend Signals | Negative Trend Signals | Hold Trend Signals |
|---|---|---|
|
|
|
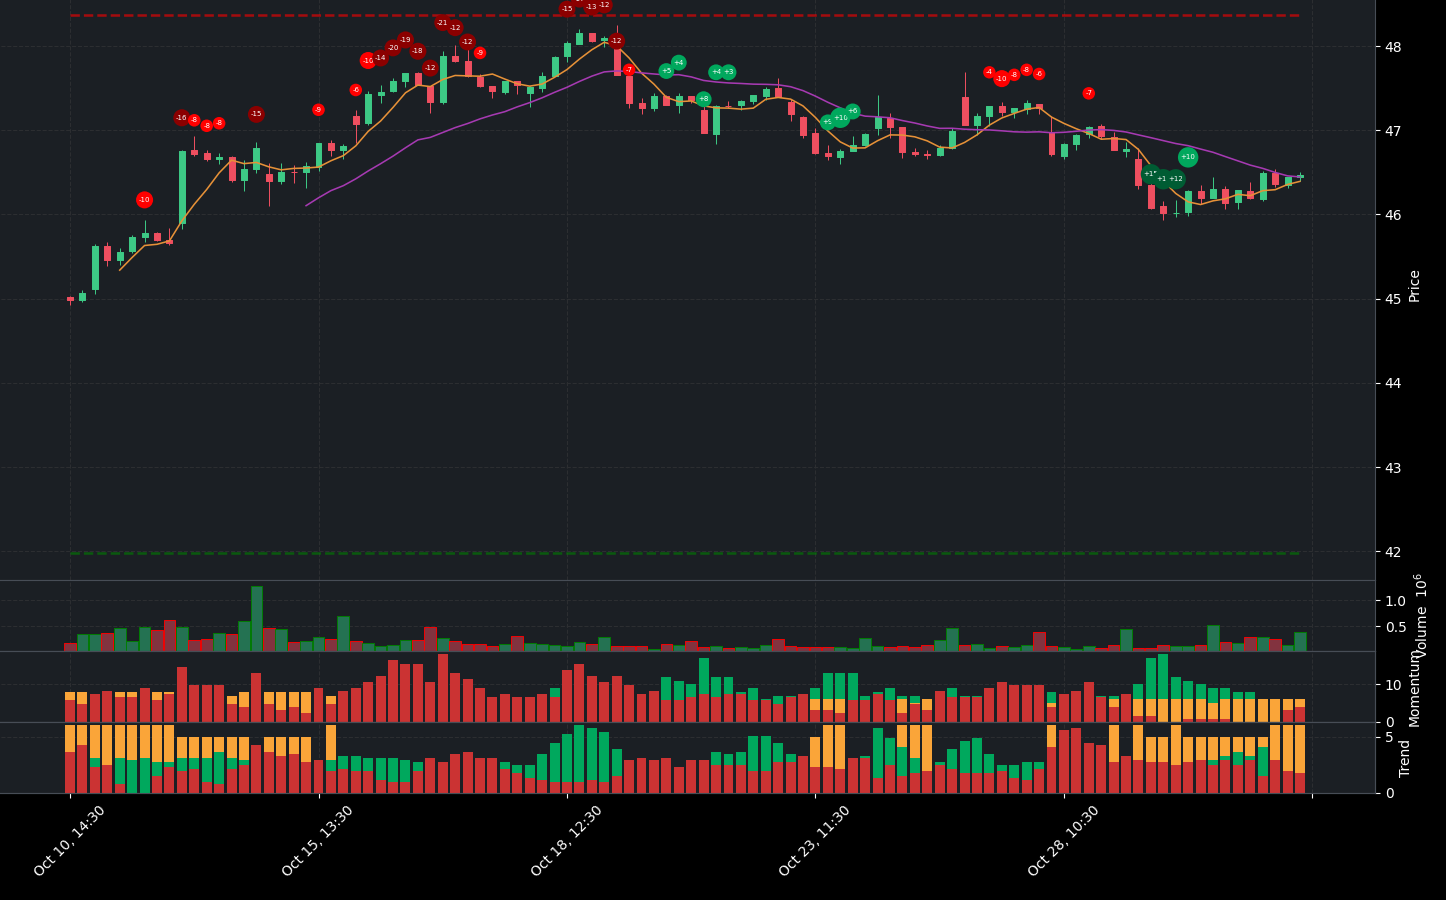
TRP stock presents a complex financial picture, characterized by both positive and negative indicators. On the positive side, the stock is currently showing signs of being oversold according to the WaveTrend indicator, which could suggest a potential bottom and an opportunity for recovery. Additionally, the price is above the 200-day EMA, indicating a bullish trend that is strengthening. The On-Balance Volume (OBV) is also increasing, supported by high volume, which typically signals strong buying interest.
However, caution is warranted as several negative indicators are present. The StochRSI is currently overbought, suggesting that the stock may be due for a pullback. Furthermore, while the price is above the middle band of the Bollinger Bands, it remains below the upper band, indicating an uptrend but also highlighting the risk of overbought conditions. The price is below the 50-day EMA, which is a bearish signal, and the Supertrend indicator confirms this bearish trend, indicating that the price is below the Supertrend line.
In summary, while TRP stock shows some potential for recovery with its oversold condition and bullish long-term trend, the presence of overbought signals and bearish short-term indicators suggests that investors should proceed with caution. A hold recommendation may be prudent, as the stock navigates through these mixed signals and investors await clearer indications of sustained upward momentum.
TRP Fundamental Analysis
TRP’s recent financial performance presents a mixed picture, with several concerning indicators that warrant careful consideration. The company reported a net income of $990 million for the most recent period; however, the year-over-year trend shows a decline, raising questions about its future profitability.
The debt-to-equity ratio stands at a high 3.96, indicating significant financial leverage and potential risk. This is compounded by a current ratio of 0.65, which suggests that the company may face challenges in meeting its short-term obligations. Additionally, a low cash to total assets ratio of 0.02 highlights limited financial flexibility and increased vulnerability to economic shocks.
In terms of valuation, the price-to-sales ratio of 2.92 suggests potential overvaluation, as it exceeds the typical threshold of 2. The forward P/E ratio of 17.08 indicates that the stock may be fairly valued, but when considered alongside other metrics, it raises further concerns.
On a more positive note, TRP boasts a strong net profit margin of 24.24%, reflecting its ability to generate profits after all expenses. However, the revenue growth year-over-year is negative at -3.72%, indicating a decline that could adversely affect future performance. The company does exhibit efficient operations, as evidenced by an operating margin of 100.00%.
From a shareholder perspective, the average ordinary shares outstanding at 1,035,692,697 raises potential dilution concerns if new shares are issued. On a positive note, stock repurchases totaling $375 million may signal confidence in the company’s future and could enhance earnings per share.
Examining the income statement, TRP reported total revenue of $4.085 billion, indicating a substantial revenue base. However, the average dilution of earnings per share at $990 million could negatively impact shareholder value. Additionally, a negative net interest income of -$590 million suggests that the company is paying more in interest than it is earning, which is a troubling sign.
The balance sheet reveals an average net debt of $61.53 billion, which necessitates further investigation into its implications for financial flexibility. The average total debt of $64.09 billion raises concerns about the company’s ability to service its debt obligations. However, an average tangible book value of $16.20 billion indicates a reasonable net worth after liabilities, though further analysis is warranted.
In terms of cash flow, average capital expenditures of $7.23 billion suggest that the company is investing in growth and expansion. However, negative free cash flow of -$2.03 billion raises alarms about the company’s ability to fund operations and invest in future growth. On a more positive note, positive net cash from financing of $13.31 billion indicates that the company is raising capital, which could be directed towards growth initiatives or debt reduction.
Overall, while TRP has some positive indicators such as strong profit margins and efficient operations, the high debt levels, declining revenue, and liquidity concerns suggest a cautious approach to investing in the stock at this time. Investors should carefully evaluate the company’s ability to navigate these challenges before making any investment decisions.
Financial Health
🔴 Net Income for the most recent period was $990 million, but the year-over-year trend shows a decrease, raising concerns about future profitability.
🔴 The Debt-to-Equity Ratio is high at 3.96, indicating significant financial leverage and potential risk.
🔴 The Current Ratio of 0.65 suggests potential liquidity risk, as the company may struggle to meet short-term obligations.
🔴 The Cash to Total Assets Ratio is low at 0.02, indicating limited financial flexibility and vulnerability to economic shocks.
Valuation
🔴 The Price-to-Sales Ratio of 2.92 suggests potential overvaluation, as it is above the typical threshold of 2.
🔴 The forward PE ratio of 17.08 indicates that the stock may be fairly valued, but combined with other metrics, it raises concerns.
Growth and Profitability
🟢 The Net Profit Margin of 24.24% is strong, reflecting the company’s ability to generate profits after all expenses.
🔴 Revenue Growth (YoY) of -3.72% indicates a decline in revenue, which could negatively impact future performance.
🟢 Operating Margin of 100.00% suggests efficient operations and good cost control, which is a positive sign.
Shareholder Information
🔴 Average Ordinary Shares Outstanding at 1,035,692,697 indicates potential dilution concerns if new shares are issued.
🟢 Stock Repurchases of $375 million can be a positive signal, as it reduces the number of shares outstanding and may boost earnings per share.
Income Statement
🟢 Total Revenue for the most recent period was $4.085 billion, indicating a substantial revenue base.
🔴 The average dilution of earnings per share was $990 million, which could impact shareholder value.
🔴 Net Interest Income of -$590 million suggests the company is paying more in interest than it is earning, which is a negative indicator.
Balance Sheet
🔴 Average Net Debt of $61.53 billion warrants further investigation into its impact on financial flexibility.
🔴 The Average Total Debt of $64.09 billion raises concerns about the company’s ability to service its debt obligations.
🟡 Average Tangible Book Value of $16.20 billion indicates a reasonable net worth after liabilities, but further analysis is needed.
Cashflow
🟢 Average Capital Expenditures of $7.23 billion suggest the company is investing in growth and expansion.
🔴 Negative Free Cash Flow of -$2.03 billion raises concerns about the company’s ability to fund operations and invest in future growth.
🟢 Positive Net Cash from Financing of $13.31 billion indicates that the company is raising capital, which could be used for growth or debt reduction.
Overall, while there are some positive indicators such as strong profit margins and efficient operations, the high debt levels, declining revenue, and liquidity concerns suggest a cautious approach to investing in TRP at this time.
TRP News Analysis
TRP News: A mixed outlook for investors.
Summary of TRP news indicates a blend of developments that could influence investor sentiment. The listing of new preferred shares and the results of conversion elections are positive moves, suggesting financial stability and investor interest. However, the broader context of fossil fuel reliance and strategic acquisitions may raise concerns about long-term sustainability. Investors should weigh these factors carefully.
🟢 TC Energy (TRP) has listed Series 10 Preferred Shares, which can enhance its capital structure and provide investors with more options.
🟢 This move indicates a proactive approach to financing and could attract more institutional investors.
🔴 The results of Series 9 Shares conversion elections were also provided, which may reflect on investor confidence but could also indicate volatility in shareholder preferences.
🔴 An article discusses Mexico’s climate scientist betting on fossil fuels, which may impact perceptions of companies like TC Energy that are involved in fossil fuel production.
🟢 The Zacks Analyst Blog highlights TC Energy, suggesting it remains on the radar of analysts, which could be a positive sign for potential investors.
🟢 The Bank of Nova Scotia’s strategic acquisition of TC Energy shares indicates institutional confidence in TRP’s future prospects.
🔴 However, the ongoing reliance on fossil fuels poses risks, especially in a shifting regulatory and environmental landscape.
🟢 TC Energy’s announcement of cash tender offers for certain debt securities suggests a focus on managing its liabilities effectively, which is a positive financial maneuver.
TRP Holders Analysis
The financial health of TRP presents a mixed outlook for the next month. While there are positive indicators, there are also concerns that warrant a cautious approach.
🟢 TRP has a **high institutional ownership** at 79.41%, indicating strong interest from large investors. This level of institutional backing can provide stability and confidence in the stock’s performance.
🔴 The **very low insider ownership** at 0.03% raises concerns about management’s confidence in the company’s future. This could suggest a lack of alignment between management and shareholder interests.
🟡 The **number of institutional holders** is substantial at 810, which indicates a diversified ownership base. This can mitigate risks associated with individual investors selling off their shares.
🟡 Recent insider transactions show minimal activity, with no significant purchases or sales reported in the last six months. This lack of engagement from insiders could imply uncertainty about the company’s direction.
🔴 The potential for increased volatility exists due to the high institutional ownership. If major institutional investors decide to sell, it could lead to significant price fluctuations.
TRP Analyst Ratings
The analyst ratings for TRP show a mixed sentiment, with a notable number of strong buy and buy recommendations. Over the last month, there have been 3 strong buy ratings, 3 buy ratings, 2 hold ratings, and 1 sell rating, indicating a generally positive outlook. However, the lack of recent strong buy upgrades suggests some caution.
🟡 In the past month, the distribution of ratings indicates a bullish sentiment, but the presence of hold and sell ratings reflects some uncertainty.
🟢 Given the overall positive analyst sentiment and the historical upgrades from firms like Credit Suisse and Goldman Sachs, TRP is likely to perform reasonably well in the next month. A target price increase of around 5% could be expected based on the current ratings and market conditions. However, the medium confidence level suggests that investors should remain vigilant for any changes in market dynamics.
TRP Economic Analysis
Based on the US economic and market data:
🔴 The unemployment rate has increased to 4.3%, up from 4.1% in the previous month, indicating a potential slowdown in the labor market which could negatively impact consumer spending and overall economic growth.
🟡 Retail sales have shown a slight increase to 627,510, but this is not a significant jump, suggesting that consumer demand may be stabilizing rather than accelerating.
🟢 The GDP growth remains relatively stable at 5737.189, which is a positive sign for the economy, but the lack of significant growth could limit the upside for TRP.
🔴 The increase in the Monthly Treasury Yield to 4.25% may lead to higher borrowing costs, which could affect capital expenditures in the energy sector, including TC Energy’s operations.
🟡 The overall commodities index has increased, which could support energy prices, but without specific data on crude oil prices, the impact remains uncertain.
In summary, while there are some positive indicators, the increase in unemployment and the potential for rising interest rates create a cautious outlook for TRP in the next month. The stock may experience volatility, but the fundamentals of the company remain relatively stable.
Disclaimer
Investors may consider the AI predictions and news summaries as one factor in their investment decisions alongside their own research and risk tolerance.


