TSLA Stock Analysis: A Mixed Outlook Ahead!
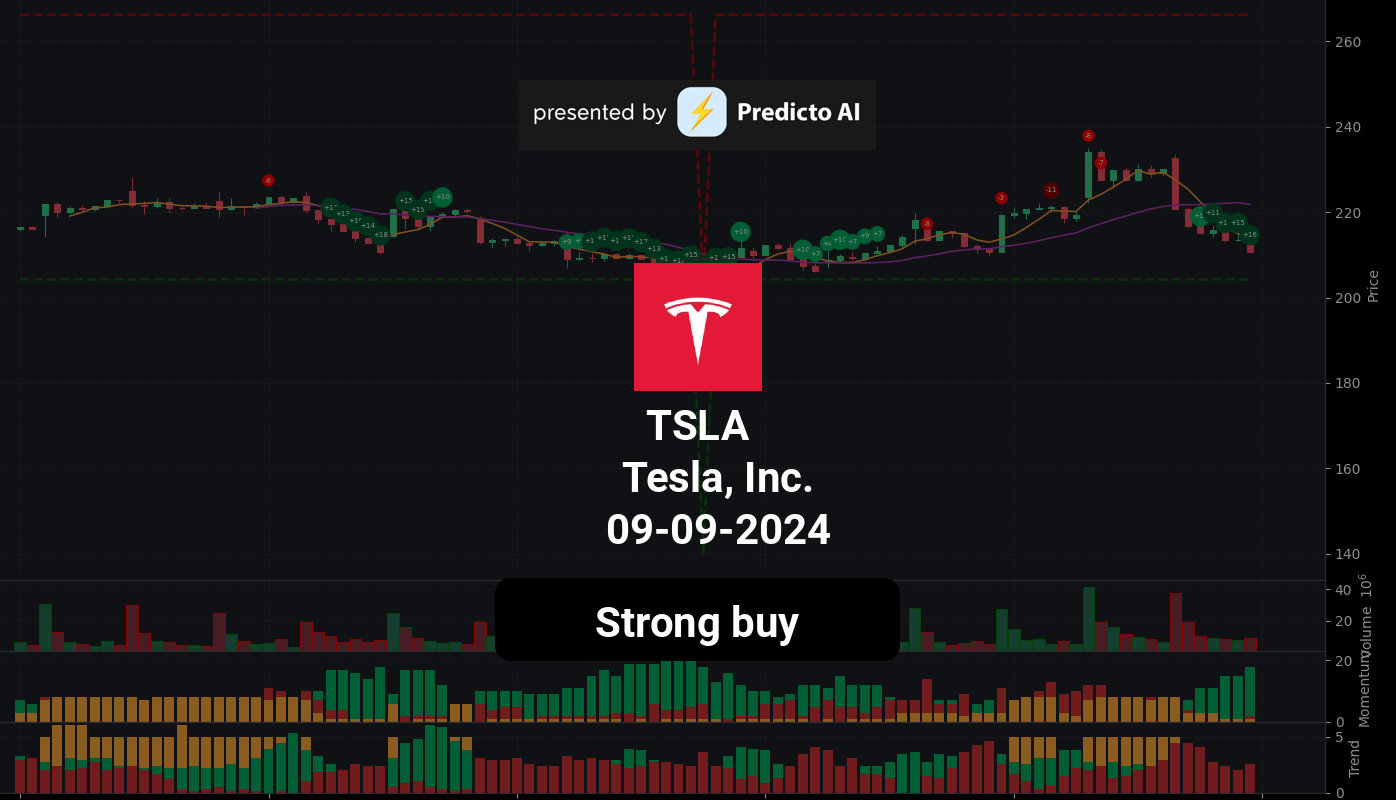
🔴 Recommendation: Tesla, Inc. (TSLA) is currently rated as a strong buy, but investors should tread carefully given the mixed signals from various indicators.
📈 Key Highlights:
Financial Health: Positive net income of $1.48 billion and a strong current ratio of 4.33 indicate solid liquidity.
Growth Potential: Year-over-year revenue growth of 19.71% showcases Tesla’s robust expansion capabilities.
Insider Confidence: High insider ownership at 13.00% and substantial institutional backing at 47.11% reflect strong confidence in the company’s future.
⚠️ Caution Flags:
Valuation Concerns: A forward P/E ratio of 67.76 suggests potential overvaluation, raising questions about the stock’s price relative to earnings.
Profitability Issues: A low net profit margin of 5.80% and negative earnings growth of -46.20% could signal challenges ahead.
As we delve deeper into the analysis, we will explore the price trends, momentum indicators, financial health, valuation metrics, and the latest news surrounding TSLA to provide a comprehensive overview of what investors can expect in the coming month. Stay tuned for an in-depth breakdown! 👇
TSLA Price Analysis
| Positive Momentum Signals | Negative Momentum Signals | Hold Momentum Signals |
|---|---|---|
|
|
|
| Positive Trend Signals | Negative Trend Signals | Hold Trend Signals |
|---|---|---|
|
|
|
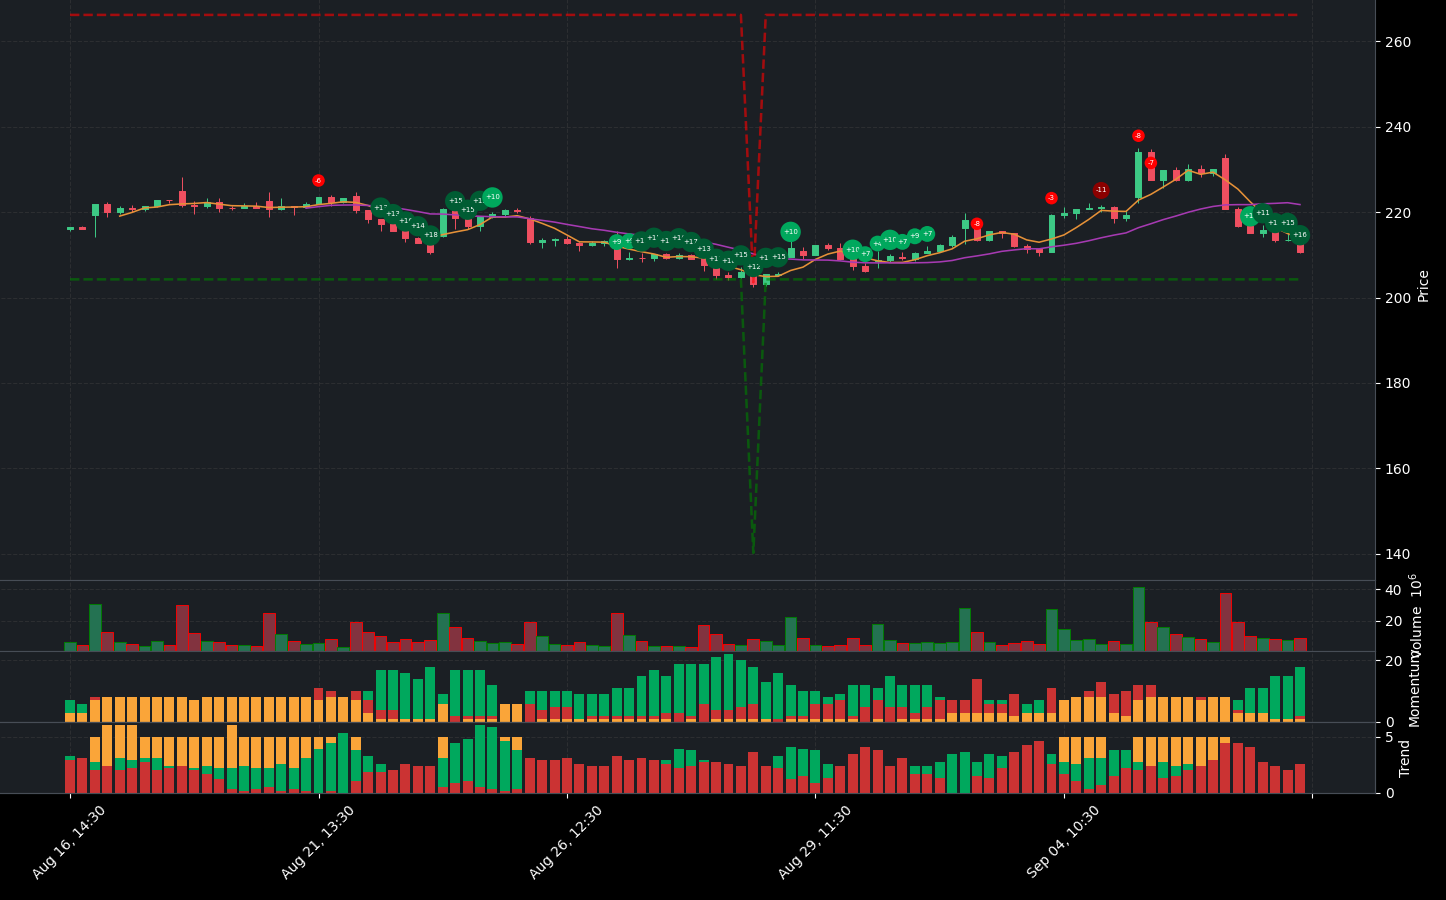
Tesla, Inc. (TSLA) presents a complex investment landscape characterized by both positive and negative indicators. Currently, the stock is rated as a strong buy, reflecting optimism among analysts despite some underlying challenges.
On the positive side, several momentum indicators suggest potential upward movement. The On-Balance Volume (OBV) shows a bullish divergence with confirmation, indicating that buying pressure may be increasing. Additionally, the Stochastic RSI is in an oversold condition and also exhibits a bullish divergence, which could signal a reversal in price trends. The WaveTrend indicator is also in an oversold state, hinting at a potential bottom. Furthermore, the stock’s position is closer to support, which may provide a buffer against further declines.
However, there are notable negative momentum indicators that investors should consider. The Stochastic RSI has recently experienced a bearish crossover, which could indicate a short-term decline. Additionally, the stock is currently below the 50-day and 200-day Exponential Moving Averages (EMAs), both of which are indicative of a bearish trend. The Supertrend indicator also confirms this bearish sentiment, as the price remains below the Supertrend line.
In terms of trend indicators, while the stock’s position is closer to support, it is important to note that it is below the Middle Band of its Bollinger Bands, suggesting a downtrend. The decreasing OBV further reinforces the bearish trend, indicating that selling pressure may be outweighing buying pressure.
Given this mixed picture, investors should approach TSLA with caution. While the strong buy rating reflects potential for recovery, the presence of significant bearish indicators suggests that volatility may persist. A prudent strategy could involve monitoring the stock closely for signs of a trend reversal while being prepared for potential short-term fluctuations. Overall, a hold or cautious buy recommendation may be appropriate until clearer signals of sustained upward momentum emerge.
TSLA Fundamental Analysis
TSLA’s recent financial performance presents a mixed picture, but overall, it leans towards a strong buy recommendation due to several positive indicators.
The company reported a net income of $1.48 billion for the most recent period, showcasing its profitability. Furthermore, the year-over-year increase in net income is a promising sign for future performance. TSLA’s current ratio stands at 4.33, indicating a healthy liquidity position that allows the company to comfortably cover its short-term liabilities. However, the net profit margin of 5.80% is relatively low, which could raise concerns among investors regarding overall profitability. Additionally, the debt-to-equity ratio of 0.16 suggests a moderate level of leverage, which is manageable given the company’s profitability.
In terms of valuation, there are some red flags. The forward P/E ratio of 67.76 and a price-to-sales ratio of 7.06 indicate potential overvaluation, suggesting that the stock may be priced too high relative to its earnings and sales.
When examining growth and profitability, TSLA reported revenue of $25.5 billion, with a year-over-year growth of 19.71%, indicating strong growth potential. However, the earnings growth of -46.20% raises concerns about future profitability and suggests challenges in sustaining growth. The operating margin of 8.58% is also low, which may indicate inefficiencies in operations.
Regarding shareholder information, the average ordinary shares outstanding is 3.18 billion, reflecting a stable shareholder base. However, the absence of buybacks, indicated by an average treasury shares count of 0, could limit enhancements to shareholder value.
The income statement shows an operating margin of 100.00%, which appears inconsistent with the reported operating margin of 8.58%. Additionally, the average dilution of earnings per share is concerning, as it may negatively impact shareholder value.
On the balance sheet, the average tangible book value of $59.07 billion reflects a strong net worth after liabilities. However, the cash to total assets ratio of 0.14 indicates limited financial flexibility, posing risks in economic downturns. The average total debt of $9.2 billion requires further analysis to understand its impact on financial health.
Finally, in terms of cash flow, the average free cash flow is negative at -$907.25 million, raising concerns about the company’s ability to fund operations and growth. On a positive note, the average capital expenditures of $6.83 billion suggest that the company is investing in growth and expansion, which bodes well for future performance.
In summary, while there are notable concerns regarding profitability and valuation, TSLA’s strong revenue growth and healthy liquidity position indicate significant potential for future growth, justifying a strong buy recommendation. Investors should weigh these factors carefully when considering an investment in TSLA.
Financial Health
🟢 Net Income for the most recent period was positive at $1.48 billion, indicating profitability.
🟢 Year-over-year net income increased, which is a positive sign for future performance.
🟢 Current Ratio of 4.33 indicates a healthy liquidity position, suggesting the company can comfortably cover its short-term liabilities.
🔴 Net Profit Margin of 5.80% is relatively low, which could be a concern for investors regarding profitability.
🟢 Debt-to-Equity Ratio of 0.16 suggests a moderate level of leverage, which is manageable given the company’s profitability.
Valuation
🔴 Forward P/E ratio of 67.76 indicates potential overvaluation, suggesting that the stock may be priced too high relative to its earnings.
🔴 Price-to-Sales ratio of 7.06 also suggests potential overvaluation, as it is significantly above the typical range for most industries.
Growth and Profitability
🟢 Revenue for the most recent period was $25.5 billion, with a year-over-year revenue growth of 19.71%, indicating strong growth potential.
🔴 Earnings Growth of -46.20% raises concerns about future profitability and may indicate challenges in sustaining growth.
🔴 Operating Margin of 8.58% is low, which could indicate inefficiencies in operations.
Shareholder Information
🟢 Average Ordinary Shares Outstanding is 3.18 billion, indicating a stable shareholder base.
🔴 Average Treasury Shares at 0 suggests no buybacks, which could limit shareholder value enhancement.
Income Statement
🟢 Operating Margin of 100.00% suggests efficient operations, although this figure seems inconsistent with the reported operating margin of 8.58%.
🔴 The average dilution of earnings per share is concerning, as it may affect shareholder value.
Balance Sheet
🟢 Average Tangible Book Value of $59.07 billion reflects a strong net worth after liabilities.
🔴 Cash to Total Assets Ratio of 0.14 indicates limited financial flexibility, which could pose risks in economic downturns.
🔴 Average Total Debt of $9.2 billion requires further analysis to understand its impact on financial health.
Cashflow
🔴 Average Free Cash Flow is negative at -$907.25 million, raising concerns about the company’s ability to fund operations and growth.
🟢 Average Capital Expenditures of $6.83 billion suggest that the company is investing in growth and expansion, which is a positive sign for future performance.
Overall, while there are some concerns regarding profitability and valuation, the strong revenue growth and healthy liquidity position suggest that TSLA has significant potential for future growth, warranting a strong buy recommendation.
TSLA News Analysis
TSLA News: A mixed outlook for investors.
Summary of TSLA news indicates a blend of positive and negative developments surrounding Tesla. While discussions about potential collaborations with Musk’s AI startup could enhance Tesla’s technological edge, conflicting statements from Musk regarding revenue sharing and licensing raise concerns. Investors should weigh these factors carefully.
🟢 Musk’s AI startup has discussed a potential deal with Tesla, which could lead to advancements in technology and operational efficiency.
🔴 However, Musk has stated that reports about sharing Tesla revenue with xAI are “not accurate,” creating uncertainty about the nature of the collaboration.
🔴 Additionally, Musk emphasized that Tesla has “no need” to license xAI models, suggesting a reluctance to engage in partnerships that could dilute Tesla’s proprietary technology.
🟢 Reports indicate that Musk’s xAI could assist Tesla with Full Self-Driving (FSD) and other innovative features, which may enhance Tesla’s product offerings.
🔴 The mixed messages from Musk could lead to volatility in investor sentiment, as clarity on the partnership and its implications remains elusive.
🔴 Overall, the stock price may experience fluctuations as investors react to the ongoing developments and Musk’s statements.
TSLA Holders Analysis
The financial health and ownership structure of TSLA indicate a strong buy recommendation for the next month. The combination of high insider ownership and substantial institutional backing suggests confidence in the company’s future performance.
🟢 TSLA has a **13.00% insider ownership**, which is considered high. This indicates a strong alignment of interests between management and shareholders, generally a positive sign for investors.
🟢 The **institutional ownership stands at 47.11%**, with a significant portion of the float held by institutions. This suggests a healthy mix of institutional and retail investors, which can provide stability to the stock price.
🟢 There are **3,764 institutional holders**, indicating widespread interest from institutions and a high degree of diversification in ownership. This is a positive indicator of confidence in TSLA’s future.
🟡 Recent insider transactions show a mix of purchases and sales, but the overall sentiment remains positive, with more purchases than sales in the last six months. This suggests that insiders are still confident in the company’s prospects.
🟢 Major institutional holders like **Vanguard Group Inc. and Blackrock Inc.** have substantial stakes, which reflects strong institutional confidence in TSLA’s growth potential.
🟡 The stock has shown resilience in the face of market fluctuations, maintaining a relatively stable price range, which is a good sign for potential investors.
🔴 However, there has been some recent volatility in the stock price, which could be a concern for short-term investors.
TSLA Analyst Ratings
The analyst ratings for TSLA show a mixed sentiment, with a notable number of analysts recommending holds and sells. In the past month, there have been 4 strong buy ratings, 14 buy ratings, 17 hold ratings, 7 sell ratings, and 4 strong sell ratings. This indicates a neutral to slightly bullish sentiment among analysts.
🔴 The recent downgrade from GLJ Research to sell and the number of hold ratings suggest some caution regarding TSLA’s near-term performance. However, the upgrades from firms like William Blair and Baird to outperform indicate that there is still optimism about the company’s long-term prospects.
🟡 Given the mixed ratings and the recent analyst actions, it is likely that TSLA will experience moderate fluctuations in the next month. A forecasted price range could be between $240 and $260, reflecting potential volatility but also opportunities for gains.
Overall, while there are positive indicators, the presence of numerous hold and sell ratings suggests that investors should proceed with caution.
TSLA Economic Analysis
Based on the US economic and market data:
🔴 The unemployment rate has increased to 4.3%, up from 4.1% in the previous month, indicating a potential slowdown in the labor market. This could lead to reduced consumer spending, negatively impacting Tesla’s sales.
🟡 Retail sales have shown a positive trend, increasing to 627,510, which suggests that consumer demand remains relatively strong. However, the growth rate is modest, and it may not significantly boost Tesla’s revenue in the short term.
🔴 The recent CPI data indicates inflationary pressures, which could lead to higher interest rates. This environment is generally unfavorable for growth stocks like Tesla, as higher borrowing costs can dampen consumer spending and investment.
🟢 Despite these challenges, Tesla’s strong brand and market position in the electric vehicle sector may help it weather economic fluctuations better than its competitors. The company’s innovative products and expansion plans could still attract investors.
Overall, while there are some positive indicators, the rising unemployment rate and inflation concerns create a cautious outlook for Tesla’s stock price in the next month.
Disclaimer
Investors may consider the AI predictions and news summaries as one factor in their investment decisions alongside their own research and risk tolerance.

