
Visa Inc. (V) Stock Analysis: A Mixed Outlook with Strong Potential!
🔴 Recommendation: Despite some cautionary signals, Visa Inc. is presenting a compelling case for investors with a mix of positive momentum and some bearish indicators.
📈 Key Highlights:
Positive Momentum: A confirmed buy signal from the WaveTrend indicator suggests potential upward movement, supported by a bullish trend as the stock trades above both the 50-day and 200-day EMA.
Financial Health: Strong profitability with a net income of $4.87 billion and an impressive operating margin of 130.90%.
Analyst Support: Overwhelmingly positive analyst ratings with 13 strong buy recommendations, indicating confidence in Visa’s growth potential.
⚠️ Caution Flags:
Bearish Divergence: The Money Flow Index (MFI) and Stochastic RSI show signs of bearish divergence, raising concerns about potential pullbacks.
Overbought Conditions: The Relative Strength Index (RSI) is currently in overbought territory, suggesting the stock may be due for a correction.
Let’s dive into the details as we break down the price trends, indicators, financial health, valuation metrics, and more 👇
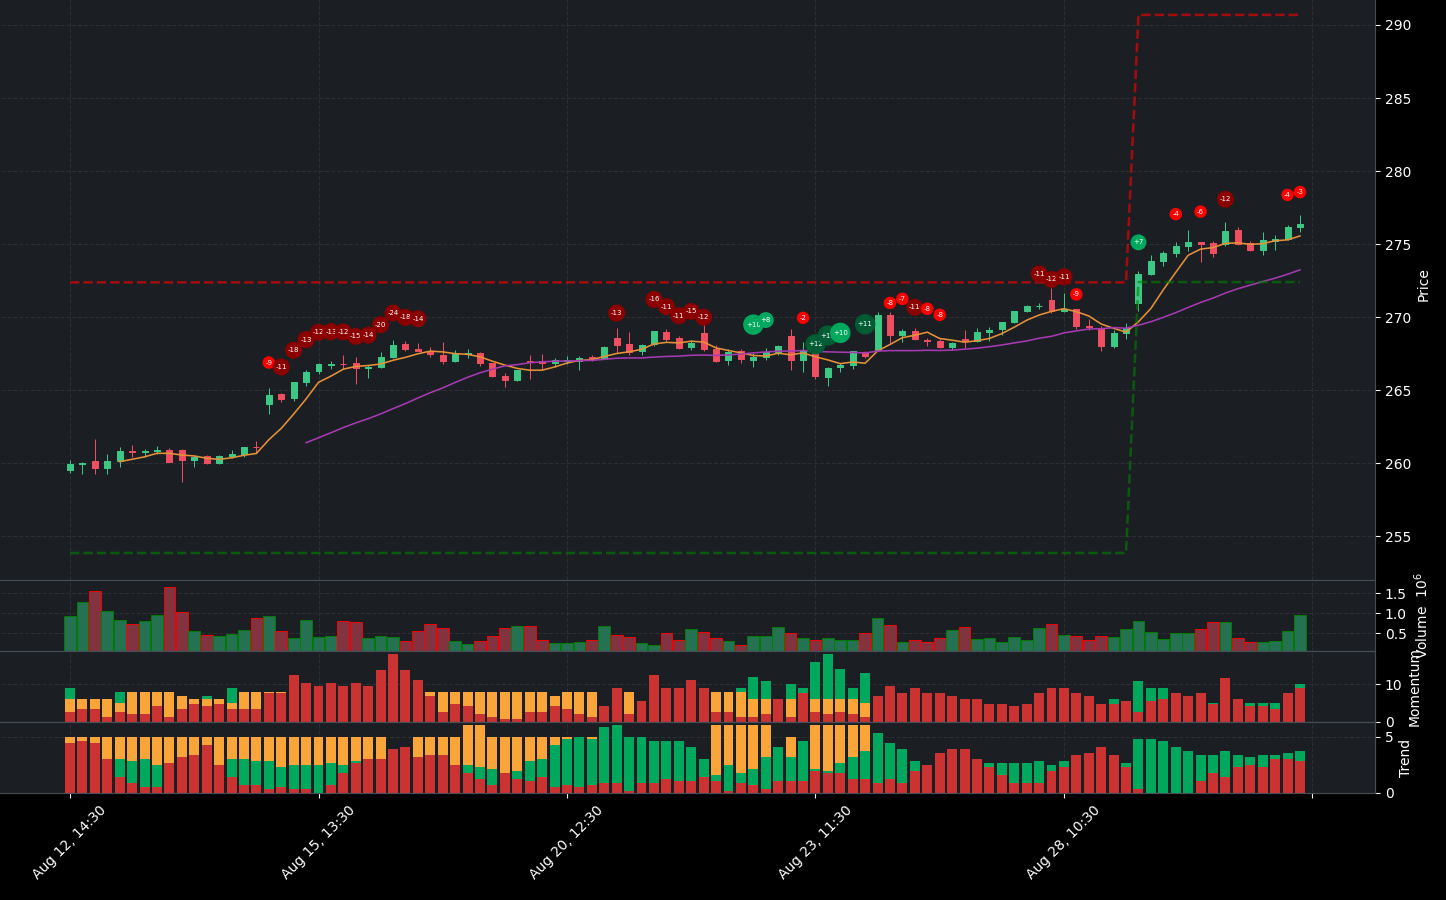
V Price Analysis
| Positive Momentum Signals | Negative Momentum Signals | Hold Momentum Signals |
|---|---|---|
|
|
|
| Positive Trend Signals | Negative Trend Signals | Hold Trend Signals |
|---|---|---|
|
|
V stock presents a complex picture for investors, characterized by both positive and negative indicators. On the positive side, the stock is currently showing a confirmed buy signal from the WaveTrend indicator, suggesting potential upward momentum. Additionally, the price is positioned closer to support, which could provide a favorable entry point for buyers. The stock is also benefiting from a bullish trend, as it is trading above both the 50-day and 200-day EMA, indicating a strengthening bullish trend. Furthermore, the On-Balance Volume (OBV) is increasing, supported by high volume, which typically signals strong buying interest.
However, caution is warranted due to several negative momentum indicators. The Money Flow Index (MFI) is showing a bearish divergence, while the Stochastic RSI indicates both a bearish crossover and bearish divergence. Additionally, the Relative Strength Index (RSI) is currently in the overbought territory, which could suggest that the stock is due for a pullback. The MACD has also shown a negative histogram crossover, further indicating potential weakness in momentum.
In summary, while V stock has some positive trends and indicators suggesting potential upward movement, the presence of significant bearish signals and overbought conditions raises concerns. Investors should approach with caution, considering a sell recommendation until clearer signals of sustained growth and momentum emerge.
V Fundamental Analysis
V’s recent financial performance presents a compelling case for investment, showcasing strong profitability and growth potential. The company reported a net income of $4.87 billion for the most recent period, reflecting robust profitability. Notably, year-over-year net income has increased, indicating positive momentum in earnings. The operating margin stands at an impressive 130.90%, demonstrating highly efficient operations and excellent cost control, while the net profit margin of 54.74% underscores the company’s strong ability to generate profits after all expenses.
However, there are some concerns to consider. The negative net interest income of – $196 million raises potential issues regarding interest expenses relative to income. Additionally, the average net debt of $6.30 billion warrants further investigation into its impact on the company’s financial flexibility.
In terms of valuation, V’s forward P/E ratio of 24.99 suggests a reasonable valuation given its growth prospects. Conversely, the price-to-sales ratio of 15.40 indicates that the stock may be overvalued relative to its revenue generation.
Growth metrics are promising, with an earnings growth rate of 20.20% indicating strong growth potential, while revenue growth of 9.60% suggests positive momentum, albeit at a moderate pace. The company’s high profit margins further demonstrate its efficiency in generating profits. Although operating cash flow is not explicitly provided, the positive free cash flow of $14.70 billion indicates healthy cash generation.
From a shareholder perspective, V has shown positive net cash from financing activities of $4.17 billion, indicating effective capital raising. The company has also engaged in stock repurchases amounting to $10.12 billion, signaling confidence in its future and potentially enhancing shareholder value.
On the balance sheet, V’s current ratio of 6.01 indicates a very healthy liquidity position, suggesting that the company can comfortably cover its short-term liabilities. However, the debt-to-equity ratio of -3.52 suggests a moderate level of leverage, which may be sustainable depending on the company’s industry and profitability. Additionally, the average tangible book value of -$5.85 billion raises concerns about the company’s net worth after liabilities.
In terms of cash flow, the average capital expenditures of $867.5 million indicate that the company is investing in growth and expansion. The positive free cash flow further supports the notion that V has cash available for investments, debt reduction, or dividends.
Overall, V demonstrates strong profitability and growth potential, despite some concerns regarding debt and valuation metrics. The positive cash flow and efficient operations bolster the recommendation to buy. Investors should weigh these factors carefully when considering an investment in V.
Financial Health
🟢 Net Income for the most recent period was $4.87 billion, showing strong profitability.
🟢 Year-over-year net income increased, indicating positive momentum in earnings.
🟢 Operating Margin of 130.90% suggests highly efficient operations and excellent cost control.
🟢 Net Profit Margin of 54.74% reflects the company’s strong ability to generate profits after all expenses.
🔴 Net Interest Income was negative at -$196 million, indicating potential concerns regarding interest expenses relative to income.
🔴 Average Net Debt of $6.30 billion warrants further investigation into its impact on financial flexibility.
Valuation
🟢 Forward P/E ratio of 24.99 indicates reasonable valuation given the growth prospects.
🔴 Price-to-Sales Ratio of 15.40 suggests the stock may be overvalued relative to its revenue generation.
Growth and Profitability
🟢 Earnings Growth of 20.20% indicates strong growth potential.
🟢 Revenue Growth of 9.60% suggests positive growth momentum, although moderate.
🟢 High profit margins demonstrate the company’s ability to generate profits efficiently.
🔴 Operating Cash Flow is not explicitly provided, but the positive free cash flow of $14.70 billion indicates healthy cash generation.
Shareholder Information
🟢 Positive net cash from financing activities of $4.17 billion indicates the company is raising capital effectively.
🟢 Stock repurchases of $10.12 billion can signal confidence in the company’s future and may enhance shareholder value.
Income Statement
🟢 Total revenue for the most recent period was $8.90 billion, reflecting solid revenue generation.
🟡 Year-over-year revenue growth of 1.42% suggests moderate growth, which could still be positive for the stock price.
Balance Sheet
🟢 Current Ratio of 6.01 indicates a very healthy liquidity position, suggesting the company can comfortably cover its short-term liabilities.
🔴 Debt-to-Equity Ratio of -3.52 suggests a moderate level of leverage, which may be sustainable depending on the company’s industry and profitability.
🔴 Average Tangible Book Value of -$5.85 billion raises concerns about the company’s net worth after liabilities.
Cashflow
🟢 Average Capital Expenditures of $867.5 million suggest the company is investing in growth and expansion.
🟢 Positive free cash flow indicates the company has cash available for investments, debt reduction, or dividends.
Overall, the company shows strong profitability and growth potential, despite some concerns regarding debt and valuation metrics. The positive cash flow and efficient operations further support a buy recommendation.
V News Analysis
Visa Inc. (V) is showing strong positive momentum with recent upgrades and favorable spending data.
Summary of Visa news indicates a robust outlook for investors. The upgrade from BNP Paribas Exane and positive spending trends from the Asia Pacific region during the upcoming Olympic Games are significant indicators of growth. Additionally, Visa’s inclusion in recent stock recommendations further enhances its attractiveness. Investors should consider these factors as they point towards a potential increase in stock value.
🟢 BNP Paribas Exane has upgraded Visa to Outperform from Neutral, raising the price target to $325 from $250.
🟢 This upgrade reflects confidence in Visa’s growth potential and suggests that analysts expect the stock to perform well in the near future.
🟢 Visa’s data shows a boost in spending from the Asia Pacific region, particularly related to the Olympic Games in Paris 2024, indicating strong consumer activity.
🟢 The company is gaining attention as a recommended stock, which could attract more investors and drive demand.
🟢 Visa is also partnering with SEEDS Academy to promote sustainability, enhancing its corporate social responsibility profile.
🔴 Despite the positive news, investors should remain cautious of market volatility and external economic factors that could impact stock performance.
V Holders Analysis
The financial health of Visa Inc. (V) presents a mixed outlook for the next month, leaning towards a buy recommendation. The high institutional ownership indicates strong interest from large investors, but the very low insider ownership raises some concerns about management’s confidence in the company’s future.
🟢 Visa has a **high institutional ownership** at 92.86%, which reflects significant confidence from large investors like Vanguard Group and Blackrock. This level of institutional backing typically supports stock price stability and growth.
🟡 The **very low insider ownership** at 0.60% suggests that management may not have a strong personal stake in the company’s performance, which could indicate a lack of confidence or a reliance on external investors for support.
🟢 The **number of institutional holders** is substantial at 5064, indicating a diversified ownership base that can help mitigate volatility. This widespread interest from institutions is generally a positive sign for the stock.
🟡 Recent **insider transactions** show a mix of sales and minimal purchases, which could reflect a cautious approach from management. While there are some insider sales, they appear to be part of regular portfolio management rather than a lack of faith in the company’s prospects.
🔴 The **high institutional ownership** could lead to increased volatility if major investors decide to sell, especially in response to market fluctuations or economic changes.
V Analyst Ratings
The analyst ratings for V (Visa Inc.) are overwhelmingly positive, with a significant number of analysts recommending either a buy or strong buy. Over the past three months, there have been 13 strong buy ratings, 22 buy ratings, 4 hold ratings, and no sell or strong sell ratings. This indicates a very bullish sentiment among analysts. 🟢
In the last month, the consistency of recommendations from firms like JP Morgan, Macquarie, and Citigroup, all maintaining their positive outlook, reinforces the strong buy sentiment. The lack of downgrades and the presence of multiple upgrades suggest that analysts are confident in Visa’s growth potential and market position.
Given the strong analyst support and the positive market conditions, it is likely that V will perform well in the next month. A forecasted price increase of approximately 5-7% is reasonable based on historical performance and current analyst sentiment.
Overall, the strong buy recommendation reflects a robust outlook for Visa, supported by high confidence in its continued performance.
V Economic Analysis
Based on the US economic and market data:
🟢 The **unemployment rate** has increased slightly to **4.3%**, but this is still relatively low, indicating a stable labor market which supports consumer spending.
🟢 **Retail sales** have shown a positive trend, increasing to **627,510**, suggesting that consumers are willing to spend, which is beneficial for Visa’s transaction volumes.
🔴 The **CPI** remains high at **314.540**, indicating persistent inflation, which could lead to increased interest rates. This may negatively impact consumer spending in the long run.
🟢 Visa’s **profit margins** are strong at **54.7%**, and the company continues to show robust revenue growth of **9.6%** year-over-year, which is a positive indicator for its stock price.
🟡 The **NASDAQ** and **S&P 500** indices have not shown recent data, but historically, a stable or growing economy supports financial services companies like Visa.
Overall, while there are some concerns regarding inflation, the underlying consumer spending and Visa’s strong financial performance suggest a positive outlook for the next month. The target price estimates range from **250** to **340**, with a mean target of **304.07**, indicating potential upside from the current price of **276.37**.
In summary, the combination of stable employment, increasing retail sales, and Visa’s strong fundamentals supports a **buy** recommendation, albeit with **medium confidence** due to inflation concerns.
Disclaimer
Investors may consider the AI predictions and news summaries as one factor in their investment decisions alongside their own research and risk tolerance.


