
Visa (V) Stock Analysis: A Cautious Buy Recommendation!
🔴 Recommendation: Visa is presenting a mixed outlook with both positive and negative indicators, suggesting a cautious buy strategy for investors.
📈 Key Highlights:
Profitability: Strong net income of $4.87 billion, showcasing robust profitability and efficient operations.
Growth: Earnings growth of 9.40% indicates healthy expectations for future performance.
Institutional Support: High institutional ownership at 93.03% reflects significant confidence from large investors.
⚠️ Caution Flags:
High Debt: Average net debt of $6.30 billion raises concerns about financial flexibility.
Overvaluation: Price-to-sales ratio of 15.71 suggests potential overvaluation compared to revenue.
As we delve deeper into the analysis, we will explore the price trends, technical indicators, financial health, valuation metrics, and the overall market sentiment surrounding Visa. Stay tuned for a comprehensive breakdown of what lies ahead for this financial giant! 👇
V Price Analysis
| Positive Momentum Signals | Negative Momentum Signals | Hold Momentum Signals |
|---|---|---|
|
|
| Positive Trend Signals | Negative Trend Signals | Hold Trend Signals |
|---|---|---|
|
|
|
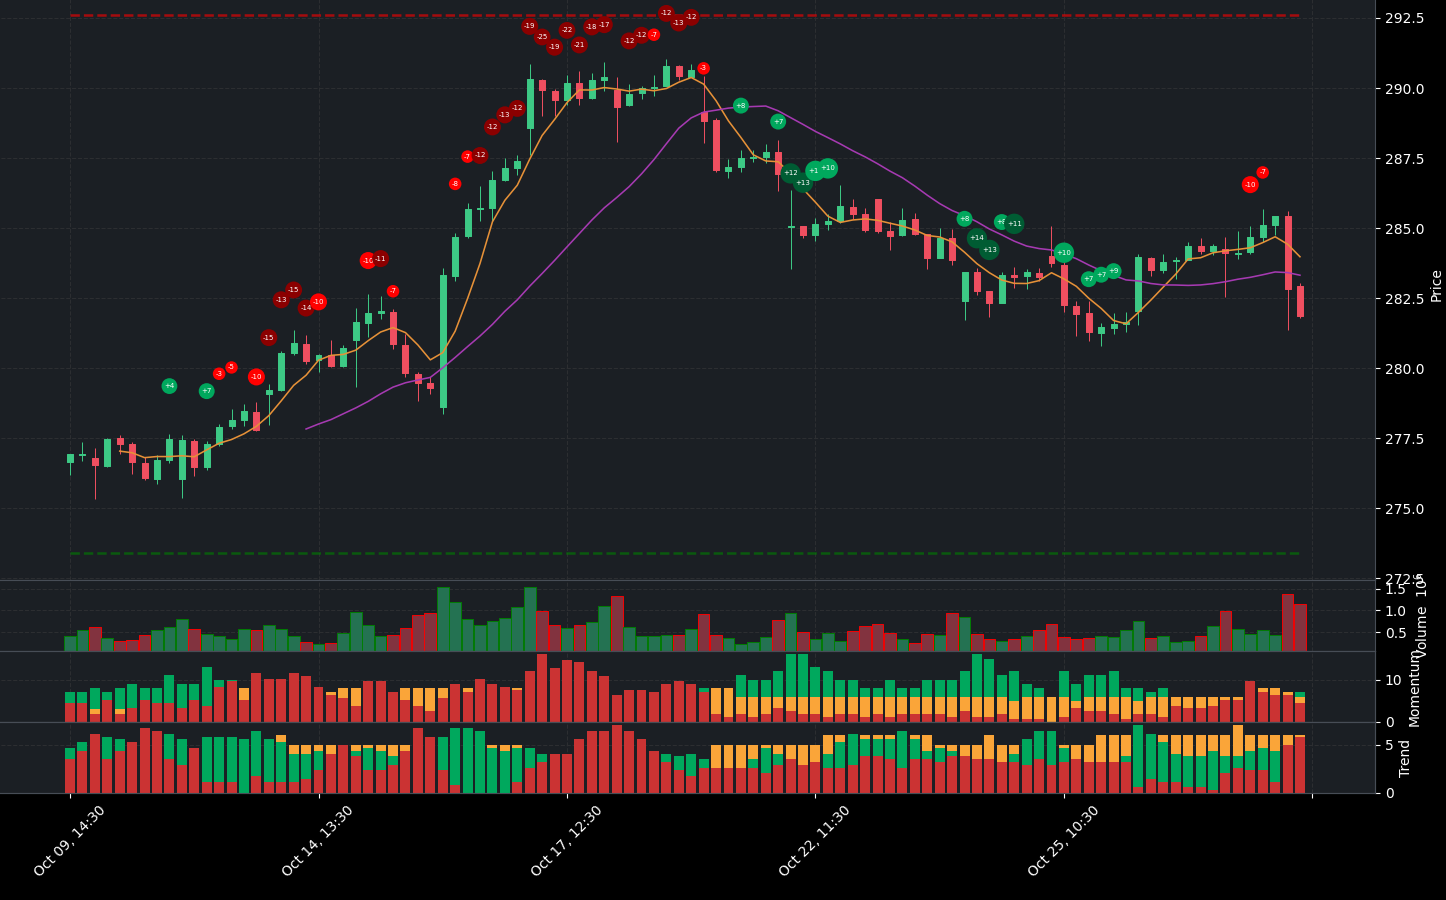
V stock presents a complex picture for investors, characterized by both potential opportunities and significant challenges. Currently, the stock is experiencing a neutral price action, which indicates a lack of strong directional movement. However, there are some noteworthy indicators to consider.
On the positive side, the WaveTrend indicator suggests that V is oversold, which could indicate a potential bottom and a possible reversal in price direction. Additionally, the stock is trading above its 200-day EMA, signaling a bullish trend that is strengthening. This long-term trend is a positive sign for investors looking for stability.
Conversely, there are several negative indicators that cannot be overlooked. The price is currently below the 50-day EMA, which indicates a bearish trend that is also strengthening. Furthermore, the stock is below the Middle Band but above the Lower Band, suggesting that while it is in a downtrend, caution is warranted due to the oversold conditions. The On-Balance Volume (OBV) is decreasing, indicating that the volume of trades is not supporting the current price levels, which could be a sign of weakening investor interest.
Moreover, the Supertrend indicator is bearish, reinforcing the notion that the stock is currently under pressure. The combination of these bearish indicators suggests that while there may be potential for a rebound due to oversold conditions, the overall trend remains negative.
In summary, V stock is at a crossroads. While there are some positive signs, such as being above the 200-day EMA and the potential for a reversal indicated by the WaveTrend, the prevailing bearish trends and decreasing volume present significant risks. Investors should approach with caution, considering a hold or sell strategy until clearer signals of a turnaround emerge.
V Fundamental Analysis
V’s recent financial performance presents a compelling case for investment, characterized by strong profitability and efficient operations. The company reported a positive net income of $4.87 billion for the most recent period, reflecting robust profitability. Additionally, the year-over-year increase in net income indicates positive momentum in earnings, further solidifying investor confidence.
The company’s operating margin stands at an impressive 130.90%, showcasing its ability to manage costs effectively. Coupled with a net profit margin of 54.74%, V demonstrates a strong capacity to generate profits after accounting for all expenses. However, it is important to note that the net interest income was negative at -$196 million, suggesting that the company is currently paying more in interest on its debts than it is earning from its assets.
In terms of valuation, V’s forward P/E ratio of 22.51 indicates a reasonable valuation relative to expected earnings growth. However, the price-to-sales ratio of 15.71 is relatively high, which may suggest potential overvaluation when compared to revenue.
When examining growth and profitability, V shows a revenue growth of 1.42% year-over-year, indicating moderate growth, which is a positive sign for future performance. The earnings growth of 9.40% suggests that the company is expected to grow its earnings at a healthy rate, supported by high profit margins that reflect efficient profit generation.
From a shareholder information perspective, V has positive net cash from financing at $4.17 billion, indicating effective capital raising. The company has also engaged in stock repurchases amounting to $10.12 billion, which can enhance earnings per share by reducing the number of shares outstanding.
Looking at the income statement, total revenue for the most recent period was $8.90 billion, indicating a solid revenue base. However, the year-over-year revenue growth of 1.42% suggests that while the company is growing, it may not be at an aggressive pace.
The balance sheet reveals some concerns, with an average net debt of $6.30 billion, which necessitates further investigation into its impact on financial flexibility and debt servicing capabilities. The debt-to-equity ratio of -3.52 indicates a moderate level of leverage, which could be sustainable depending on the company’s industry and profitability. On a positive note, the current ratio of 6.01 suggests a very healthy liquidity position, allowing the company to comfortably cover its short-term liabilities. However, the cash to total assets ratio of 0.16 indicates limited financial flexibility and a higher vulnerability to economic shocks.
In terms of cash flow, V’s average capital expenditures of $867.5 million suggest that the company is investing in growth and expansion. Furthermore, positive free cash flow indicates that the company has cash available for investments, debt reduction, or dividends.
Overall, V exhibits strong profitability and efficient operations, with moderate growth and a solid liquidity position. While high debt levels and potential overvaluation in terms of the price-to-sales ratio are areas of concern, the positive indicators outweigh the negatives. This leads to a recommendation to buy, as the company’s strengths present a favorable investment opportunity.
Financial Health
🟢 Net Income for the most recent period was positive at $4.87 billion, showing strong profitability.
🟢 Year-over-year net income increased, indicating positive momentum in earnings.
🟢 Operating Margin of 130.90% suggests highly efficient operations and excellent cost control.
🟢 Net Profit Margin of 54.74% reflects the company’s strong ability to generate profits after all expenses.
🔴 Net Interest Income was negative at -$196 million, indicating the company is paying more in interest on its debts than it is earning on its assets.
Valuation
🟢 Forward P/E ratio of 22.51 suggests reasonable valuation relative to expected earnings growth.
🔴 Price-to-Sales Ratio of 15.71 is relatively high, indicating potential overvaluation compared to revenue.
Growth and Profitability
🟢 Revenue Growth of 1.42% year-over-year indicates moderate growth, which is a positive sign for future performance.
🟢 Earnings Growth of 9.40% suggests the company is expected to grow its earnings at a healthy rate.
🟢 High profit margins demonstrate the company’s ability to generate profits efficiently.
Shareholder Information
🟢 Positive net cash from financing at $4.17 billion indicates the company is raising capital effectively.
🟢 Stock repurchases of $10.12 billion can be a positive signal as it reduces the number of shares outstanding, potentially boosting earnings per share.
Income Statement
🟢 Total revenue for the most recent period was $8.90 billion, indicating a solid revenue base.
🔴 Year-over-year revenue growth of 1.42% is moderate, suggesting that while the company is growing, it may not be at an aggressive pace.
Balance Sheet
🔴 Average Net Debt is high at $6.30 billion, which warrants further investigation into its impact on financial flexibility and ability to service debt obligations.
🔴 Debt-to-Equity Ratio of -3.52 suggests a moderate level of leverage, which may be sustainable depending on the company’s industry and profitability.
🟢 Current Ratio of 6.01 indicates a very healthy liquidity position, suggesting the company can comfortably cover its short-term liabilities.
🔴 Cash to Total Assets Ratio of 0.16 indicates limited financial flexibility and a higher vulnerability to economic shocks.
Cashflow
🟢 Average Capital Expenditures of $867.5 million suggest the company is investing in growth and expansion.
🟢 Positive free cash flow indicates the company has cash available for investments, debt reduction, or dividends.
Overall, the company shows strong profitability and efficient operations, with moderate growth and a solid liquidity position. However, the high debt levels and potential overvaluation in terms of the Price-to-Sales ratio are areas of concern. Overall, the positive indicators outweigh the negatives, leading to a recommendation to buy.
V News Analysis
A strong outlook for Visa (V) based on recent positive news and price target adjustments.
Summary of Visa news indicates a robust performance and positive sentiment from analysts. The adjustments in price targets by multiple financial institutions reflect confidence in Visa’s growth potential. The company’s recent earnings beat and resilient consumer spending further bolster its attractiveness as an investment. Investors should consider entering or holding their positions in Visa stock.
🟢 Susquehanna has adjusted its price target on Visa to $339 from $326 while maintaining a positive rating, indicating confidence in the stock’s future performance.
🟢 Visa has reported fourth-quarter income that beat estimates, showcasing strong financial health amid resilient consumer spending.
🟢 Citigroup has raised its price target on Visa to $326 from $319, keeping a buy rating, which suggests continued optimism about the stock.
🟢 Morgan Stanley has also adjusted its price target to $326 from $322 while maintaining an overweight rating, reinforcing the positive outlook.
🟢 Deutsche Bank has increased its price target on Visa to $340 from $300, maintaining a buy rating, which signals strong confidence in Visa’s growth trajectory.
🟢 TD Cowen has raised its price target to $325 from $318, also maintaining a buy rating, further indicating positive sentiment.
🟢 Goldman Sachs has adjusted its price target to $324 from $325 while keeping a buy rating, reflecting a stable outlook for Visa.
V Holders Analysis
The financial health of V (Visa Inc.) presents a mixed outlook, suggesting a cautious buy recommendation for the next month. The high institutional ownership indicates strong backing, but the very low insider ownership raises some concerns.
🟢 Visa has a **high institutional ownership** at 93.03%, which reflects significant interest from large investors like Vanguard Group and Blackrock. This level of institutional support typically indicates confidence in the company’s future performance.
🔴 However, the **very low insider ownership** at 0.60% suggests a lack of confidence from company management. This could imply that insiders do not see enough value in holding onto their shares, which may be a red flag for potential investors.
🟡 The **number of institutional holders** is substantial at 5048, indicating a diversified ownership structure. This diversification can help stabilize the stock price, but it also means that any significant sell-off by these institutions could lead to increased volatility.
🟢 Recent **insider transactions** show a mix of sales and purchases, but the overall sentiment is not overwhelmingly bullish. The presence of insider sales could indicate that insiders are cashing out, which might reflect their outlook on the company’s near-term performance.
🔴 The stock has experienced some fluctuations in recent months, and while the institutional backing remains strong, the low insider ownership and mixed transaction activity warrant a cautious approach.
V Analyst Ratings
The analyst ratings for V (Visa) are overwhelmingly positive, with a significant majority recommending either a buy or strong buy. Over the past month, there have been 13 strong buy ratings, 22 buy ratings, 4 hold ratings, and no sell or strong sell ratings. This indicates a very bullish sentiment among analysts. 🟢
The consistent upgrades from firms such as Baird, Piper Sandler, and BMO Capital, all maintaining an outperform rating, further reinforce the positive outlook for Visa. The lack of any sell or strong sell recommendations suggests that analysts have high confidence in the stock’s performance.
In the past month, the stock has shown resilience and growth potential, supported by strong fundamentals and a favorable market environment. Given the current analyst sentiment and the absence of negative ratings, it is likely that Visa will continue to perform well in the next month.
V Economic Analysis
Based on the US economic and market data:
🟢 The **unemployment rate** has increased slightly to **4.3%**, but this is still relatively low, indicating a stable labor market that supports consumer spending.
🟢 **Retail sales** have shown a positive trend, increasing to **627,510**, which suggests that consumers are willing to spend, benefiting Visa’s transaction volumes.
🔴 The **CPI** remains high at **314.540**, indicating persistent inflation, which could lead to increased interest rates. This may pressure consumer spending in the long run.
🟢 Visa’s **profit margins** are strong at **54.7%**, and the company has a solid **return on equity** of **48.5%**, indicating effective management and profitability.
🟡 The **trailing PE ratio** of **29.0** suggests that Visa is relatively expensive compared to its earnings, but the forward PE of **22.5** indicates potential for growth.
Overall, while there are some inflationary pressures, the strong consumer spending and Visa’s solid fundamentals support a positive outlook for the next month. The stock price is currently at **281.88**, with a target mean price of **311.37**, suggesting a potential upside of approximately **10.5%**.
End of comment.
Disclaimer
Investors may consider the AI predictions and news summaries as one factor in their investment decisions alongside their own research and risk tolerance.


