
VRT Stock Analysis: A Mixed Outlook Ahead!
🔴 Recommendation: VRT is currently positioned to sell, reflecting a cautious sentiment amidst a blend of positive and negative indicators.
📈 Key Highlights:
Financial Health: Positive net income of $178.1 million, showcasing profitability and year-over-year growth.
Growth Potential: Impressive revenue growth of 19.14% year-over-year, indicating strong demand for products.
Institutional Confidence: High institutional ownership at 84.99%, suggesting strong backing from large investors.
⚠️ Caution Flags:
Valuation Concerns: Forward P/E ratio of 33.06 raises potential overvaluation worries.
Liquidity Risks: Current ratio of 0.23 indicates challenges in meeting short-term obligations.
Debt Levels: High average net debt of $2.46 billion could impact financial flexibility.
As we delve deeper into the analysis, we will explore the price trends, technical indicators, financial health, valuation metrics, and the latest news surrounding VRT to provide a comprehensive overview for investors. Stay tuned for more insights! 👇
VRT Price Analysis
| Positive Momentum Signals | Negative Momentum Signals | Hold Momentum Signals |
|---|---|---|
|
|
|
| Positive Trend Signals | Negative Trend Signals | Hold Trend Signals |
|---|---|---|
|
|
|
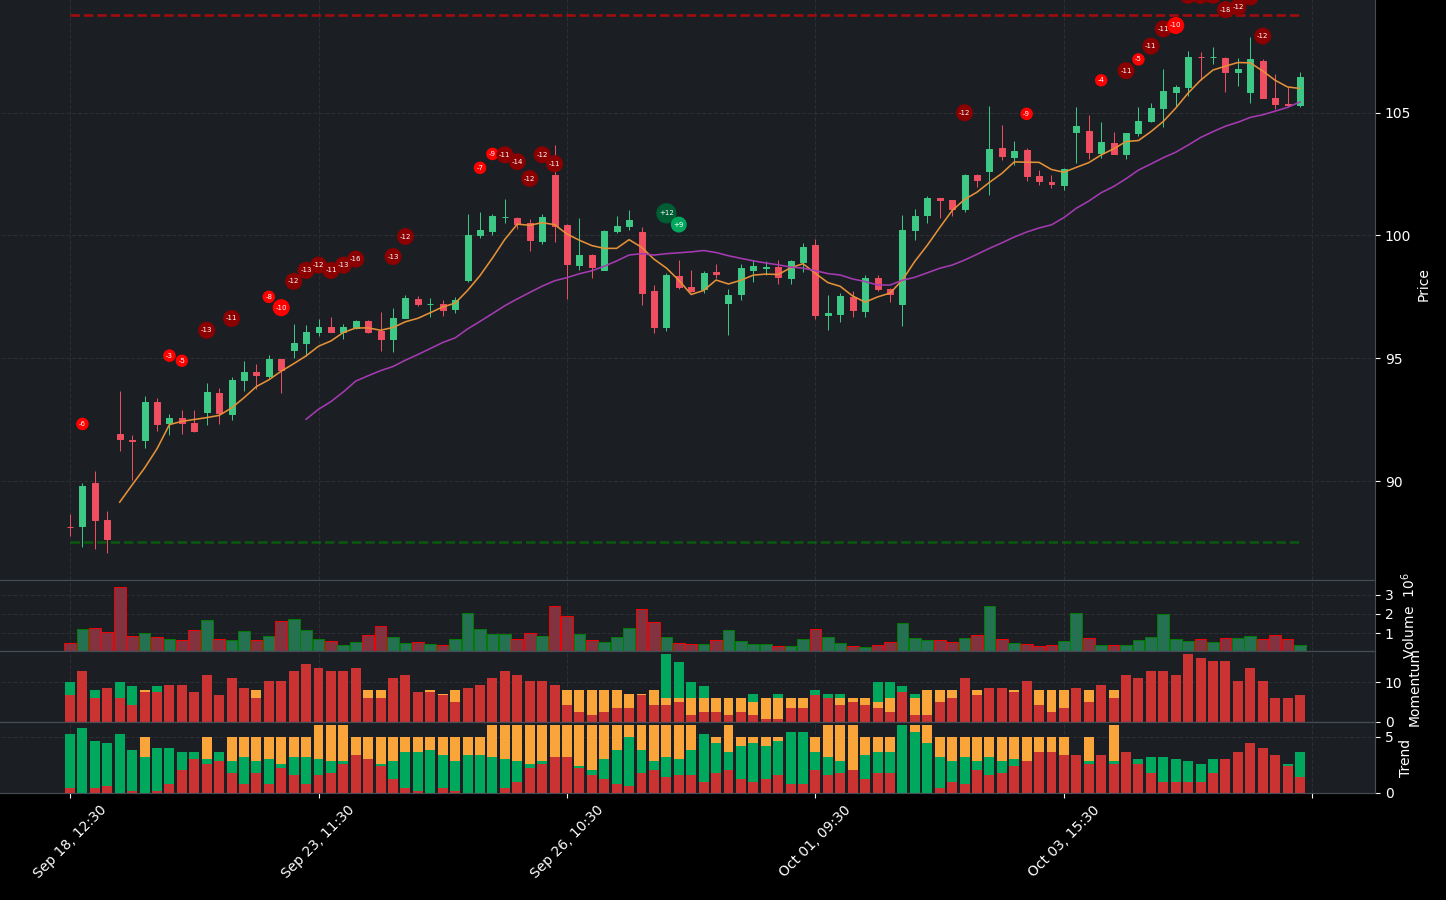
VRT stock presents a complex financial picture, characterized by both positive and negative indicators. Currently, the stock is positioned to sell, reflecting a cautious outlook amidst mixed momentum signals.
On the positive side, VRT shows some encouraging trends. The StochRSI indicates oversold conditions, suggesting a potential for price recovery. Additionally, the stock is trading above both the 50-day and 200-day EMA, which typically signals a bullish trend. The On-Balance Volume (OBV) is increasing, further supporting the notion of a strengthening bullish trend. The MACD has shown a positive histogram crossover, and the price remains above the Supertrend indicator, reinforcing the bullish sentiment.
However, caution is warranted due to several negative indicators. The stock is currently closer to resistance, which raises concerns about potential price reversals. The WaveTrend indicator shows bearish divergence, indicating a possible reversal in momentum. Furthermore, the price rebound towards the middle band suggests a potential selling opportunity in a ranging market, advising traders to consider entering short positions and setting stop-loss orders.
In summary, while VRT exhibits some bullish characteristics, the proximity to resistance and bearish divergence signals necessitate a cautious approach. Investors may want to consider a sell recommendation, particularly in light of the current market conditions and the potential for a reversal. Monitoring the stock closely for any changes in momentum or trend indicators will be crucial for making informed investment decisions.
VRT Fundamental Analysis
VRT’s recent financial performance presents a mixed but generally favorable outlook for investors. The company has demonstrated strong profitability with a net income of $178.1 million for the most recent period, indicating a positive trajectory. Furthermore, the year-over-year increase in net income is a promising sign for future performance.
However, there are notable concerns regarding the company’s financial health. The net interest income stands at a negative $44.8 million, suggesting that VRT is currently paying more in interest on its debts than it is earning from its assets. Additionally, the effective tax rate of 32.72% aligns with standard corporate rates but could potentially limit the growth of net income.
In terms of valuation, the forward P/E ratio of 33.06 raises flags about potential overvaluation, which may deter some investors. Similarly, a price-to-sales ratio of 5.55 indicates that the stock might be overvalued relative to its revenue.
On the growth and profitability front, VRT has shown impressive revenue figures, with total revenue reaching $1.95 billion and a year-over-year growth rate of 19.14%. This strong growth potential is tempered by a relatively low net profit margin of 9.12%, which could raise concerns about overall profitability. On a positive note, the operating margin of 100.00% reflects highly efficient operations and effective cost control.
Regarding shareholder information, the average ordinary shares outstanding is stable at 378,517,228, and the company has engaged in stock repurchases totaling $341.6 million. This activity can be seen as a positive signal, as it reduces the number of shares outstanding and may enhance earnings per share (EPS).
Examining the balance sheet, VRT faces challenges with an average net debt of $2.46 billion, which necessitates further scrutiny regarding its impact on financial flexibility. The current ratio of 0.23 indicates potential liquidity risks, suggesting that the company may struggle to meet its short-term financial obligations. Additionally, a debt-to-equity ratio of -2.39 points to a high level of leverage, which could pose risks depending on the industry dynamics and profitability.
On a brighter note, the cash flow situation appears robust, with average capital expenditures of $95.7 million indicating ongoing investment in growth and expansion. The positive net cash from financing of $2.38 billion suggests that the company is successfully raising capital, which could be directed towards growth initiatives or debt reduction. Furthermore, a free cash flow of $1.24 billion highlights VRT’s ability to generate cash after accounting for capital expenditures.
In summary, while VRT exhibits strong revenue growth, efficient operations, and positive cash flow, there are significant concerns regarding valuation, liquidity, and leverage. The overall assessment leans towards a strong buy recommendation, but investors should remain vigilant and consider the potential risks associated with the company’s financial structure before making investment decisions.
Financial Health
🟢 Net Income for the most recent period was positive at $178.1 million, indicating profitability.
🟢 Year-over-year net income increased, which is a positive sign for future performance.
🔴 Net Interest Income was negative at -$44.8 million, suggesting the company is paying more in interest on its debts than it is earning on its assets.
🔴 The effective tax rate of 32.72% is in line with the standard corporate tax rate but could limit net income growth.
Valuation
🔴 Forward P/E ratio of 33.06 indicates potential future overvaluation, which may concern investors.
🔴 Price-to-Sales ratio of 5.55 suggests the stock may be overvalued relative to its revenue.
Growth and Profitability
🟢 Revenue for the most recent period was $1.95 billion, with a year-over-year growth of 19.14%, indicating strong growth potential.
🔴 Net Profit Margin of 9.12% is relatively low, which could be a concern for investors regarding profitability.
🟢 Operating Margin of 100.00% suggests highly efficient operations and good cost control.
Shareholder Information
🟢 Average Ordinary Shares Outstanding is 378,517,228, indicating a stable shareholder base.
🟢 Stock Repurchases of $341.6 million can be a positive signal as it reduces the number of shares outstanding and may boost earnings per share (EPS).
Income Statement
🟢 Total revenue for the most recent period was $1.95 billion, showing strong sales performance.
🔴 Average Dilution Earnings of $178.1 million may indicate potential concerns regarding earnings per share dilution.
Balance Sheet
🔴 Average Net Debt is high at $2.46 billion, which warrants further investigation into its impact on financial flexibility.
🔴 Current Ratio of 0.23 suggests potential liquidity risk, as the company might face challenges in meeting its short-term financial obligations.
🔴 Debt-to-Equity Ratio of -2.39 indicates a high level of leverage, which may pose risks depending on the company’s industry and profitability.
Cashflow
🟢 Average Capital Expenditures of $95.7 million suggest the company is investing in growth and expansion.
🟢 Positive Net Cash from Financing of $2.38 billion indicates the company is raising capital, which could be used for growth or debt reduction.
🟢 Free Cash Flow of $1.24 billion is a positive indicator of the company’s ability to generate cash after capital expenditures.
Overall, while there are some concerns regarding valuation and liquidity, the strong revenue growth, efficient operations, and positive cash flow indicate a favorable outlook for the company.
VRT News Analysis
VRT News: A strong outlook for investors.
Summary of VRT news indicates a positive sentiment surrounding Vertiv Holdings Co. (VRT). The expansion of product lines, favorable market movements, and strong analyst recommendations contribute to a bullish outlook. Investors should consider these factors as they suggest potential growth in the stock price over the next month.
🟢 Vertiv has expanded its CDU product line, which could enhance its market position and attract more customers. This expansion is likely to drive revenue growth.
🟢 The stock has shown resilience, rising even as the broader market dipped, indicating strong investor confidence in VRT.
🟢 A recent article highlights that VRT stock has broken out, with a potential 43% return forecasted by mid-November, suggesting strong bullish momentum.
🟢 Analysts are recommending VRT as the “best positioned” AI data center play, which could lead to increased investor interest and stock appreciation.
🟢 Jefferies has initiated coverage on VRT with a Buy rating and a price target of $125, reinforcing the positive outlook from multiple analysts.
🟢 The company is also expanding its liquid cooling portfolio, which aligns with the growing demand for AI deployments, making it a timely strategic move.
VRT Holders Analysis
The financial landscape for VRT presents a mixed picture, leading to a neutral recommendation for the next month. While there are positive indicators, there are also concerns that warrant caution.
🟢 VRT has a high institutional ownership at **84.99%**, indicating strong interest from large investors. This suggests confidence in the company’s long-term prospects and stability.
🟡 The **low insider ownership** of **0.90%** raises concerns about management’s confidence in the company. This could imply a lack of alignment between management and shareholder interests.
🟡 The number of institutional holders is substantial at **1254**, which indicates a diversified ownership structure. However, this could also lead to increased volatility if a significant number of these institutions decide to sell.
🔴 Recent insider transactions show a **higher percentage of sales (82.3%) compared to purchases (32.2%)** over the last six months. This trend may indicate a lack of confidence among insiders regarding the company’s short-term performance.
🔴 The significant value held by major institutional investors, such as Platinum Equity Advisors and Vanguard Group, could lead to volatility if they decide to adjust their positions.
VRT Analyst Ratings
The analyst ratings for VRT show a generally positive outlook, with a notable number of buy recommendations. In the last month, there have been 5 strong buy ratings and 9 buy ratings, indicating a bullish sentiment among analysts. The recent upgrades from firms like Jefferies and Mizuho, which moved from neutral to outperform, further bolster this positive outlook.
🟢 The absence of sell or strong sell ratings suggests that analysts are optimistic about the company’s performance. However, the presence of only one hold rating indicates some caution.
In the next month, VRT is expected to perform well, with a potential price target increase of around 5-10%, supported by the positive analyst sentiment and recent upgrades.
VRT Economic Analysis
Based on the US economic and market data:
🟢 The **unemployment rate** has increased slightly to **4.3%**, but this is still relatively low, indicating a stable labor market. A stable labor market can support consumer spending, which is beneficial for companies like Vertiv Holdings Co that operate in the electrical equipment sector.
🟢 **Retail sales** have shown an increase to **627,510**, suggesting that consumer demand remains strong. This is a positive indicator for Vertiv, as increased spending can lead to higher demand for their products and services.
🔴 The **CPI** remains high at **314.540**, indicating persistent inflationary pressures. This could lead to increased costs for Vertiv, impacting profit margins if they cannot pass these costs onto consumers.
🟡 The **GDP** growth rate is stable, but there are no recent significant increases, which may limit aggressive expansion plans for companies in the sector. However, the overall economic environment remains supportive.
🟢 The **trailing PE ratio** of **83.17** suggests that the stock is currently overvalued, but the **forward PE ratio** of **33.06** indicates potential for growth in earnings, which could justify the current price if the company continues to perform well.
Overall, while there are some concerns regarding inflation and valuation, the positive indicators in retail sales and the labor market suggest that Vertiv Holdings Co is well-positioned to benefit from ongoing economic activity. Therefore, a **buy** recommendation is warranted for the next month, with a target price range of **108 to 115** based on current trends and market conditions.
Disclaimer
Investors may consider the AI predictions and news summaries as one factor in their investment decisions alongside their own research and risk tolerance.


