VZ Stock Analysis: A Mixed Outlook Ahead!
🔴 Recommendation: Verizon Communications Inc. (VZ) presents a complex financial landscape, with both promising opportunities and cautionary signals for investors.
📈 Key Highlights:
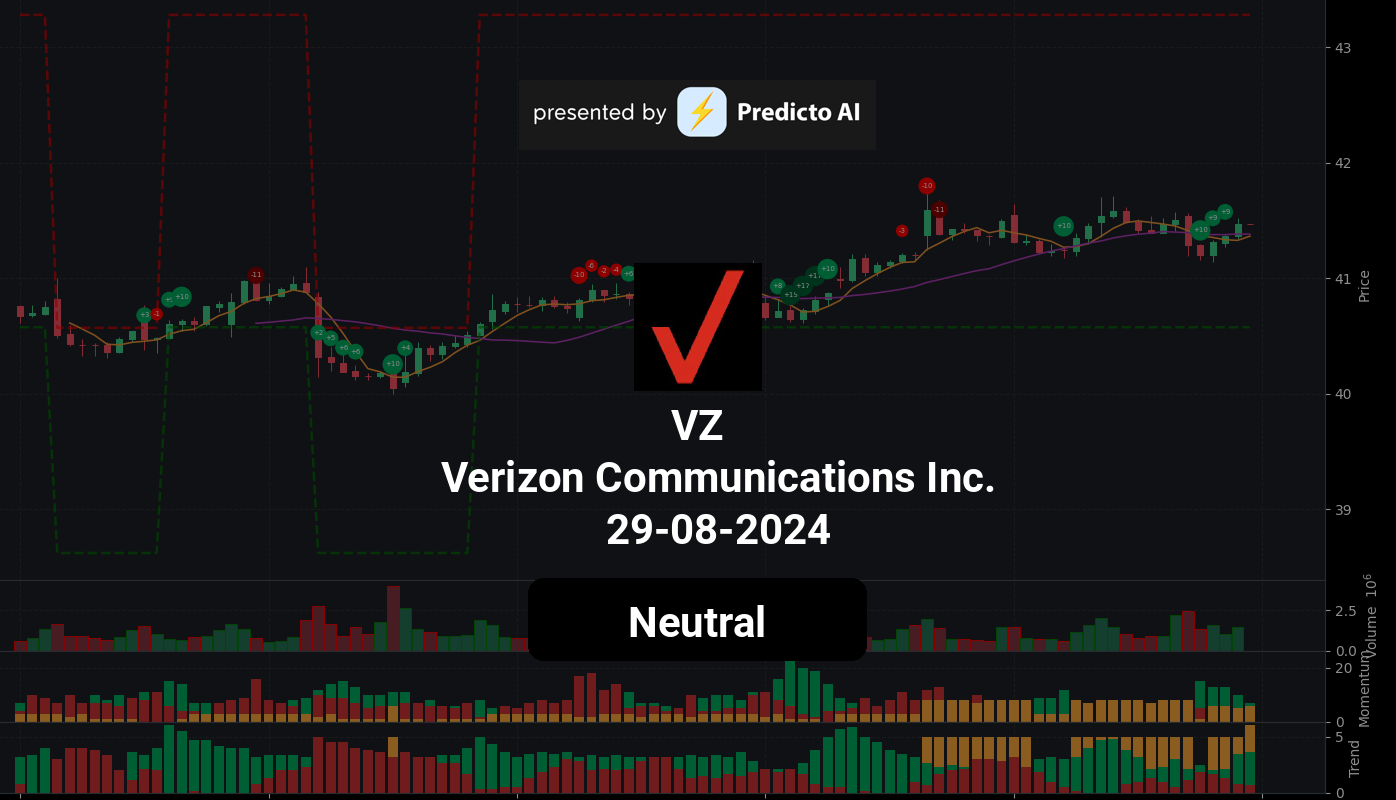
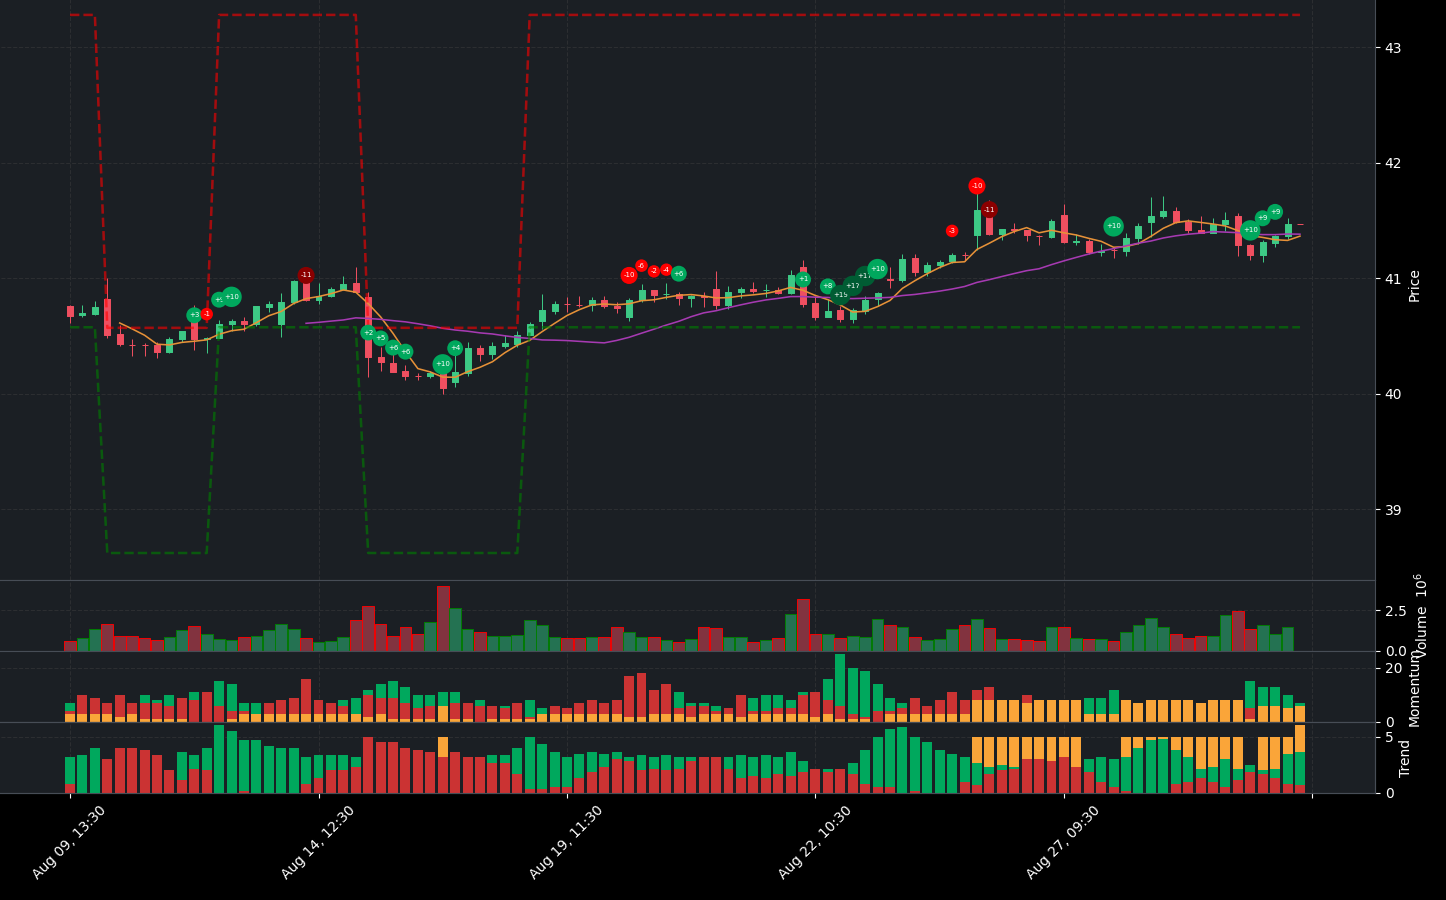
Technical Indicators: The stock is currently trading at $41.47, showing signs of being oversold according to the WaveTrend indicator, which may present a potential buying opportunity.
Momentum Trends: VZ is trading above the 50-day and 200-day Exponential Moving Averages (EMAs), indicating a bullish trend, while the MACD shows positive momentum.
Financial Health: Despite a substantial revenue base of $32.80 billion, concerns arise from a declining year-over-year revenue growth of -0.56% and a high net debt of $147.17 billion.
⚠️ Caution Flags:
Bearish Signals: The Supertrend indicator suggests a bearish trend, with the price currently below the Supertrend line, indicating potential downward pressure.
Liquidity Risks: A low current ratio of 0.13 raises concerns about the company’s ability to meet short-term obligations, while a negative net interest income indicates challenges in servicing its debt.
As we delve deeper into the details, we will break down the price trends, indicators, financial health, valuation metrics, and more to provide a comprehensive analysis of VZ’s stock performance and outlook. Stay tuned! 👇
VZ Price Analysis
| Positive Momentum Signals | Negative Momentum Signals | Hold Momentum Signals |
|---|---|---|
|
|
| Positive Trend Signals | Negative Trend Signals | Hold Trend Signals |
|---|---|---|
|
|
|
Verizon Communications Inc. (VZ) presents a complex financial landscape characterized by both positive and negative indicators. Currently, the stock is trading at a neutral price level, but there are signs of potential opportunity. The **WaveTrend indicator suggests that the stock is oversold**, indicating a possible bottom and a potential buying opportunity for investors.
On the positive side, several momentum and trend indicators are in Verizon’s favor. The stock is **trading above the 50-day and 200-day Exponential Moving Averages (EMAs)**, which signifies a **bullish trend**. Additionally, the **MACD has shown a positive histogram crossover**, further supporting the notion of upward momentum. The price is also above the middle band of its Bollinger Bands, although it is below the upper band, suggesting that while the stock is in an uptrend, investors should remain cautious of potential overbought conditions.
However, caution is warranted due to the **Supertrend indicator, which currently indicates a bearish trend**. The price is below the Supertrend line, suggesting that there may be downward pressure on the stock. This conflicting information between bullish momentum indicators and bearish trend indicators creates a challenging environment for investors.
In summary, while Verizon shows some promising signs of recovery with its oversold condition and bullish EMA trends, the bearish Supertrend indicator raises concerns. Investors should approach VZ with caution, considering a **hold** strategy until clearer signals emerge regarding its ability to sustain upward momentum in the face of current bearish trends.
VZ Fundamental Analysis
VZ’s recent financial performance presents a mixed picture, prompting a cautious outlook for potential investors. While the company boasts a substantial revenue base of $32.80 billion and strong profitability metrics, several concerning trends cannot be overlooked.
The net income for the most recent period stands at $4.59 billion, but the year-over-year trend shows a decline, raising questions about future profitability. Additionally, the company’s average net debt is notably high at $147.17 billion, which necessitates a closer examination of its impact on financial flexibility and the ability to meet debt obligations. Compounding these issues, the current ratio is alarmingly low at 0.13, indicating potential liquidity risks and challenges in fulfilling short-term financial commitments. Furthermore, the cash to total assets ratio is very low at 0.01, suggesting limited financial flexibility and increased vulnerability to economic downturns.
From a valuation perspective, the forward P/E ratio of 8.86 is below the typical threshold of 15, hinting at potential undervaluation. However, the price-to-sales ratio of 1.30 is reasonable but should be monitored closely in relation to revenue growth, which has unfortunately declined by -0.56% year-over-year.
On the profitability front, VZ maintains a strong operating margin of 100.00% and a net profit margin of 14.00%, indicating efficient operations and a solid ability to generate profits after expenses. However, the negative net interest income of -1.62 billion and high interest expense of $1.70 billion could significantly impact overall profitability.
The balance sheet reveals further concerns, with a debt-to-equity ratio of -1.82, suggesting a high level of leverage that may be unsustainable. Additionally, the average tangible book value is negative at -95.89 billion, indicating that liabilities exceed assets, which raises alarms about the company’s financial health.
On a more positive note, VZ’s average free cash flow is positive at $8.38 billion, indicating available cash for investments, debt reduction, or dividends. The company is also investing in growth, as reflected in its average capital expenditures of $35.32 billion.
In summary, while VZ exhibits some positive indicators such as strong operating and net profit margins, the declining revenue growth, high debt levels, and liquidity concerns suggest a cautious approach to investment in this company. Investors should carefully consider these factors and the overall financial landscape before making any investment decisions.
Financial Health
🔴 Net Income for the most recent period was $4.59 billion, but the year-over-year net income trend shows a decrease, raising concerns about future profitability.
🔴 Average Net Debt is high at $147.17 billion, which warrants further investigation into its impact on financial flexibility and ability to service debt obligations.
🔴 Current Ratio is low at 0.13, indicating potential liquidity risk and challenges in meeting short-term financial obligations.
🔴 Cash to Total Assets Ratio is very low at 0.01, suggesting limited financial flexibility and vulnerability to economic shocks.
Valuation
🟢 Forward P/E ratio is 8.86, which is below 15, suggesting potential future undervaluation.
🔴 Price-to-Sales Ratio is 1.30, which is reasonable but should be monitored in relation to revenue growth.
Growth and Profitability
🔴 Year-over-year revenue growth was -0.56%, indicating a decline in revenue, which could negatively impact the stock price.
🟢 Operating Margin is strong at 100.00%, suggesting efficient operations and good cost control.
🟢 Net Profit Margin is 14.00%, reflecting the company’s ability to generate profits after all expenses.
Shareholder Information
🔴 Average Ordinary Shares Outstanding is 4.21 billion, which may indicate dilution concerns if shares are issued.
🔴 Average Treasury Shares are 85.20 million, suggesting limited buyback activity.
Income Statement
🟢 Total Revenue for the most recent period was $32.80 billion, indicating a substantial revenue base.
🔴 Net Interest Income is negative at -$1.62 billion, indicating the company is paying more in interest on its debts than it is earning on its assets.
🔴 Interest Expense is high at $1.70 billion, which could impact profitability.
Balance Sheet
🔴 Debt-to-Equity Ratio is -1.82, suggesting a high level of leverage that may be unsustainable depending on the company’s industry and profitability.
🔴 Average Tangible Book Value is negative at -$95.89 billion, indicating that liabilities exceed assets, which is concerning for financial health.
Cashflow
🟢 Average Free Cash Flow is positive at $8.38 billion, indicating the company has cash available for investments, debt reduction, or dividends.
🟢 Average Capital Expenditures of $35.32 billion suggests the company is investing in growth and expansion.
Overall, while there are some positive indicators such as strong operating and net profit margins, the declining revenue growth, high debt levels, and liquidity concerns suggest a cautious approach to investment in this company.
VZ News Analysis
A mixed outlook for Verizon Communications (VZ) with several positive developments, but some caution is warranted.
Summary of Verizon Communications news indicates a generally positive sentiment with several strategic partnerships and initiatives. However, the market’s overall performance and external factors may influence stock performance in the near term.
🟢 Verizon Communications (VZ) has shown resilience, increasing in value despite a broader market slip, indicating strong investor confidence.
🟢 The partnership with Skylo to launch a direct-to-device messaging service could enhance Verizon’s service offerings and attract new customers.
🟢 Verizon Connect’s selection for the California BAR CTP Pilot demonstrates the company’s commitment to innovation and sustainability, which may improve its market position.
🔴 There are concerns regarding the overall market conditions, which could impact VZ’s stock performance in the short term.
🟢 The focus on dividend growth and potential payout increases is appealing to income-focused investors, suggesting stability in returns.
🔴 However, the competitive landscape and economic uncertainties may pose risks to Verizon’s growth trajectory.
VZ Holders Analysis
The financial landscape for VZ indicates a mixed outlook for the next month, with both positive and negative signals that warrant a neutral stance.
🟢 VZ has a **high institutional ownership** at 64.27%, which reflects significant interest from large investors. This can provide stability and confidence in the stock, as institutional investors typically conduct thorough research before investing.
🔴 However, the **very low insider ownership** at 0.04% raises concerns about management’s confidence in the company’s future. This could indicate a lack of alignment between management and shareholder interests.
🟡 The **number of institutional holders** is substantial at 3537, suggesting a diversified ownership base. This can mitigate volatility, but it also means that if a significant number of these institutions decide to sell, it could lead to increased price fluctuations.
🟡 Recent insider transactions show a **lack of purchases** and a notable amount of selling, which could be interpreted as a lack of confidence from insiders regarding the stock’s future performance.
🔴 The overall sentiment from insider transactions leans negative, as there have been more sales than purchases in recent months, indicating potential concerns about the company’s direction.
VZ Analyst Ratings
The analyst ratings for VZ indicate a mixed sentiment, with a significant number of hold ratings (24) and a moderate number of buy (6) and strong buy (2) recommendations. The recent upgrades from firms like TD Cowen and JP Morgan suggest some optimism, but the overall distribution of ratings leans towards caution.
🟡 In the past month, there have been 2 strong buy ratings, 6 buy ratings, 24 hold ratings, 0 sell ratings, and 0 strong sell ratings. This indicates a lack of strong bullish sentiment among analysts.
🔴 The high number of hold ratings suggests that analysts are uncertain about the stock’s immediate prospects, which could be influenced by broader market conditions or company-specific challenges.
VZ Economic Analysis
Based on the US economic and market data:
🔴 The unemployment rate has increased to 4.3%, up from 4.1% in the previous month, indicating a potential slowdown in the labor market. This could lead to reduced consumer spending, which may negatively impact Verizon’s revenue growth.
🟡 Retail sales have shown a slight increase, but the overall growth is modest, suggesting that consumer demand is not robust enough to significantly boost Verizon’s sales in the near term.
🔴 The CPI data indicates inflationary pressures, which could lead to increased operational costs for Verizon. If inflation continues to rise, it may affect profit margins, especially in the telecom sector where competition is fierce.
🟢 Despite these challenges, Verizon’s strong dividend yield of 6.41% remains attractive to income-focused investors, providing some support for the stock price.
🔴 The overall economic indicators suggest a cautious outlook for the telecom sector, particularly for Verizon, as rising unemployment and inflation could hinder growth prospects.
In summary, while Verizon maintains a solid dividend and has a stable business model, the current economic environment presents challenges that could limit price appreciation in the next month. The stock may fluctuate around the current price of 41.47, with potential support near the 40.00 level and resistance around 43.00.
Disclaimer
Investors may consider the AI predictions and news summaries as one factor in their investment decisions alongside their own research and risk tolerance.

